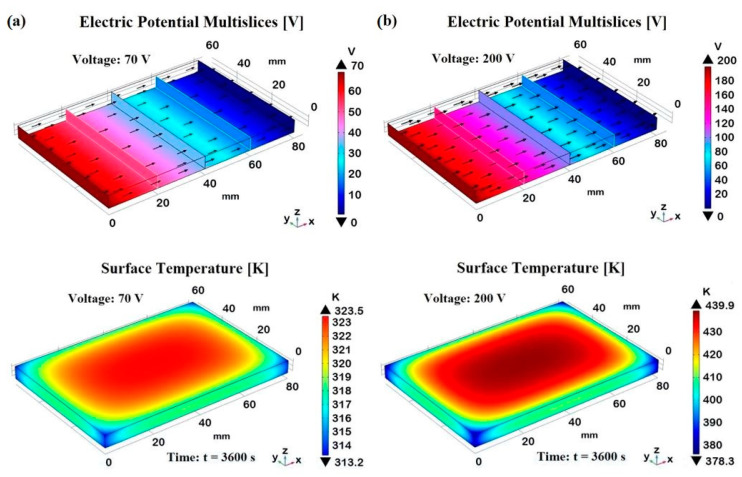
Figure 23.
Electric potential distributions (first row) along the x-axis direction to which the two voltages (70 V and 200 V) in (a,b), respectively, are applied. The second row reports the 3D views of the corresponding surface temperature (evaluated at steady-state condition, t = 3600 s) due to the Joule effect.

