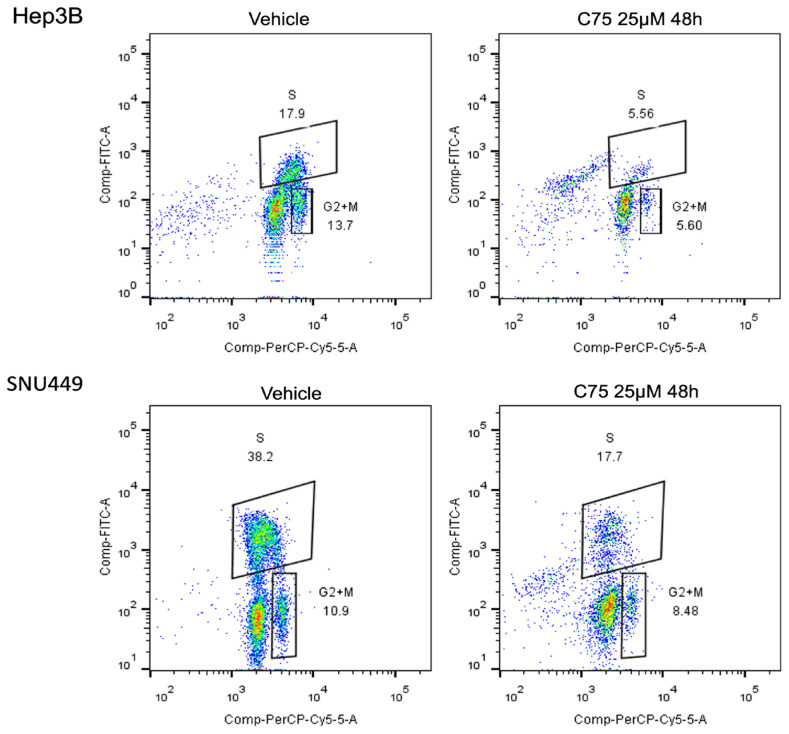
Figure 3.
Dot spot graph representative of cell cycle distribution of HCC cells treated with C75 25 μM for 48 h. For the analysis, cells were recovered, washed with PBS and the pellet solubilized in ethanol 70% and stored at −20 °C overnight. The samples were stained with 7AAD (BD Biosciences, CA, USA) and incubated for 15 min at room temperature before acquisition using the flow cytometer FACS CANTOII (BD Biosciences, CA, USA). A total of 30.000 events for each sample were acquired and data were analyzed with ModFIT LT 6.0 (Verity Software House, Topsham, ME, USA).

