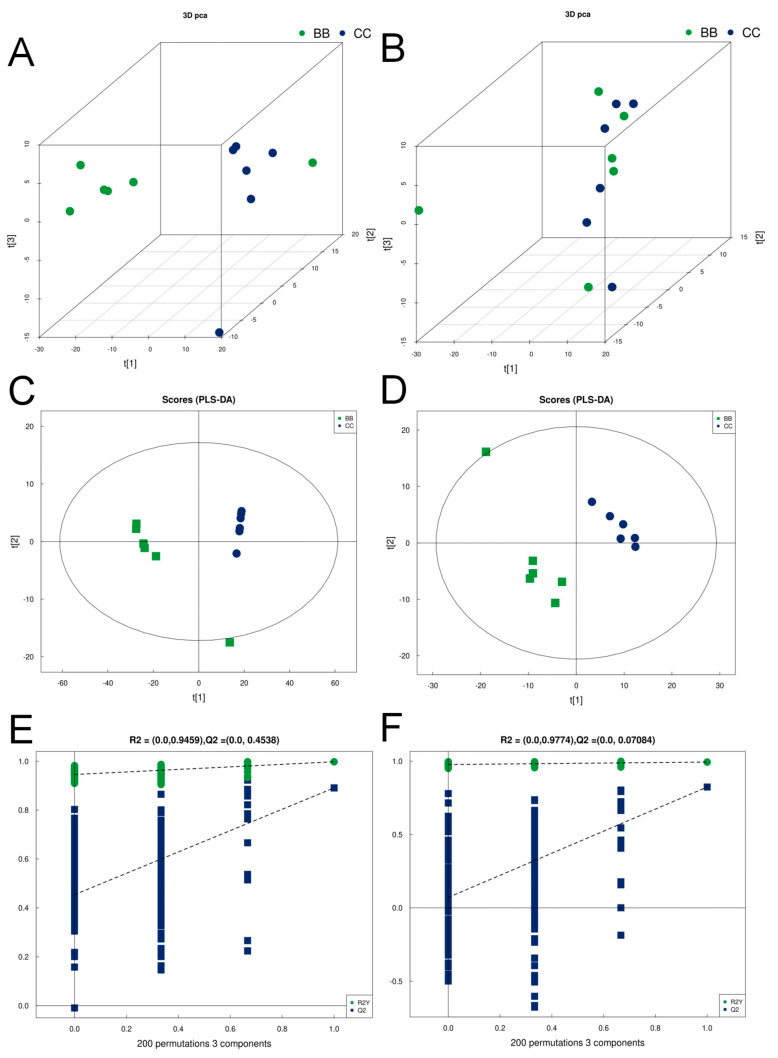
Figure 2.
Principal component analysis, PLS−DA score, and permutation test for non−targeted metabolomic differences between benzene-exposed and control group of workers. (A,B) Principal component analysis in positive and negative ion modes. (C,D) PLS−DA scores in positive and negative ion modes. (E,F) Permutation test in positive and negative ion modes.

