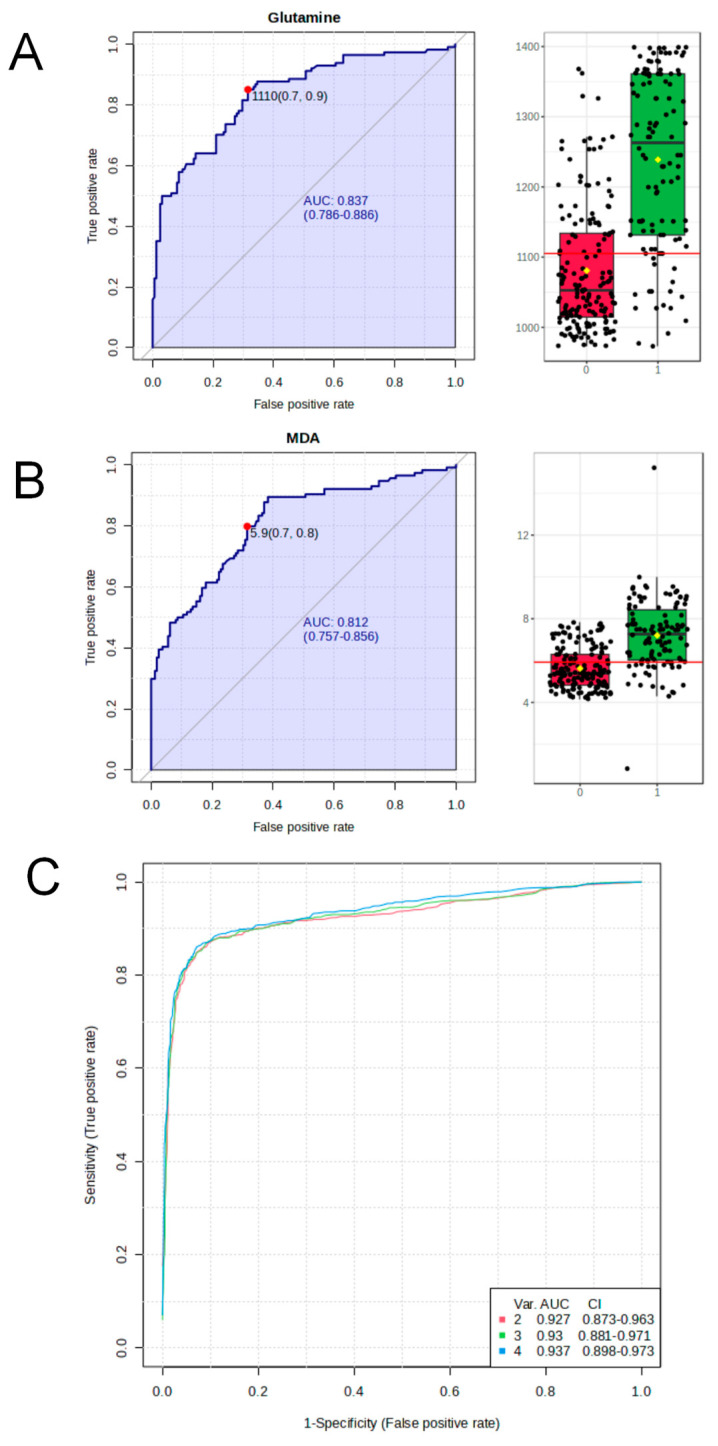
Figure 5.
Bioinformatic analysis of plasma differential metabolites in benzene–exposed and control workers. (A,B) ROC analysis of Gln and MDA based on benzene exposure and control populations,red represents the control group and green represents the benzene–exposed group. (C) Model performance analysis for assessing benzene exposure.

