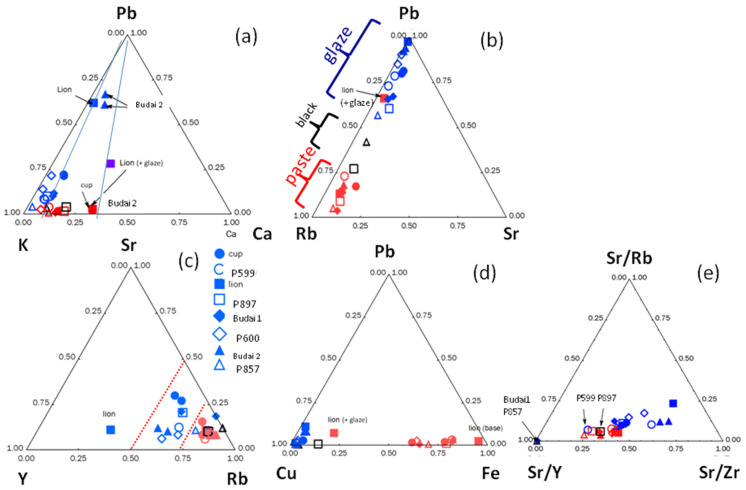
Figure 5.
Diagrams made from the relative intensity of the peak characteristic of the elements for artifacts shown in Figure 1: (a) fluxing elements (Pb, K, and Ca); (b) Pb vs. Rb (impurity of K and Na) and Sr (impurity of Ca flux) signal; (c) characteristic impurities of the fluxes (Rb, Sr) and the sand (Y); (d) Cu and Fe coloring ions vs. Pb signal; (e) Sr proportional to Rb, Y, and Zr signals (see Table 1 for sample number).

