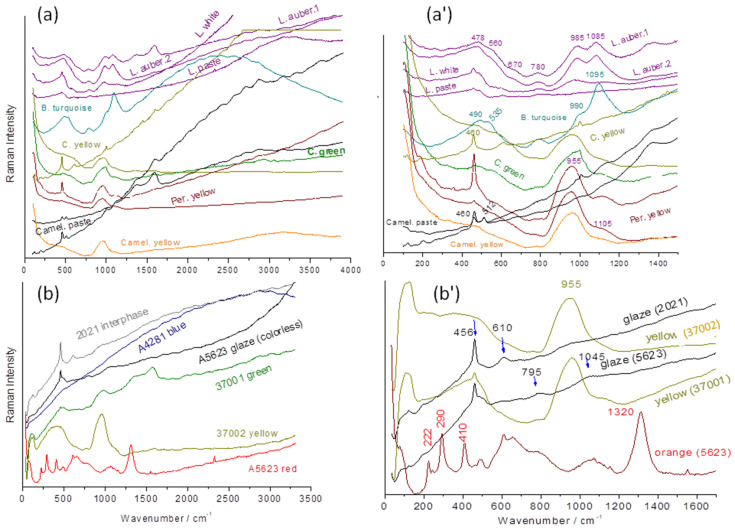
Figure 10.
Comparison of the Raman spectra recorded on the glazed surfaces of the selected artifacts (a,a’) of Figure 1 (L: fo dog; C: (camel yellow) horse; Per: parrot; B: maggot (Budai)) and Figure 2 (b,b’). On the left (a,b) exists a full range of spectra and on the right (a’,b’) spectra within the range of fundamental Raman modes. See Supplementary Information for detailed Raman spectra.

