FIG. 3.
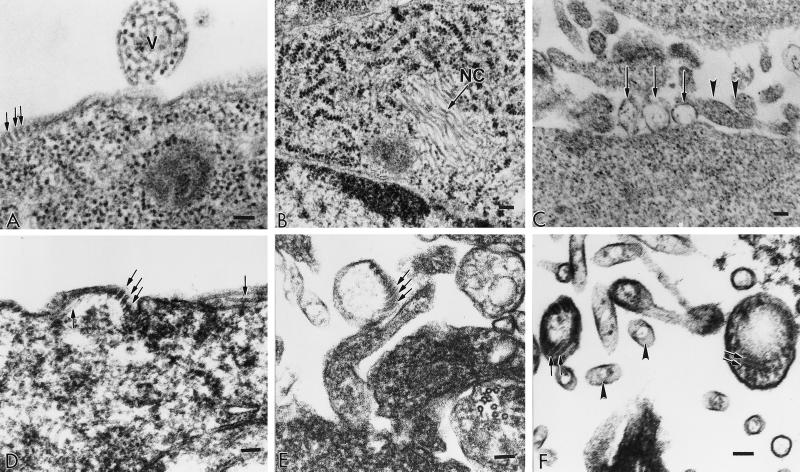
Electron micrographs of sections of 293T cells infected with hPIV-1 virus (A) or transfected with pCAGGS plasmids to express the hPIV-1 NP gene (B), the hPIV-1 M gene (C), or both the M and NP genes (D to F). Pellets of cells were fixed in cacodylate-buffered 2.5% glutaraldehyde, postfixed in 1% osmium tetroxide, dehydrated in a graded series of ethanol, and embedded in Spurr embedding medium. Ultrathin sections were cut on a Sorvall MT 6000 ultramicrotome, stained, and examined in a Phillips EM 301 electron microscope. The bar in each panel represents 100 nm. (A) V, budding virus particle; arrows, NC structures beneath the plasma membrane; (B) arrow, bundles of hollow NC-like structures; (C) arrows, vesicles budding from the cell surface; arrowheads, cross-sectioned microvilli; (D) arrows, NC-like structures beneath the plasma membrane; (E) arrows, NC-like structures enclosed in vesicles budding from the plasma membrane; (F) arrows, NC-like structures enclosed in vesicles that have been released from the plasma membrane; arrowheads, cross-sectioned microvilli.

