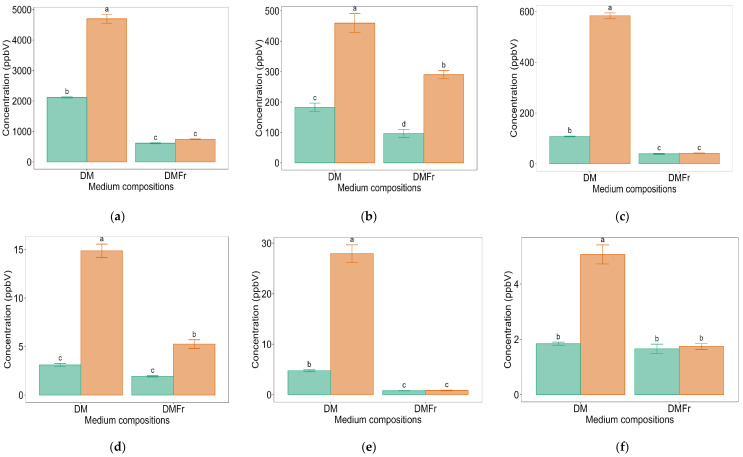
Figure 4.
Mean concentrations (ppbV) of m/z 45.033 (t.i. acetaldehyde) (a) m/z 49.011 (t.i. methanethiol) (b) m/z 89.060 (t.i. ethyl acetate) (c) m/z 91.027 (t.i. methyl thiolacetate/mercaptoacetone) (d) m/z 91.072 (t.i. 2,3 butanediol) (e) and m/z 121.057 (t.i. benzeneacetaldehyde) (f) across defined medium compositions (DM: glucose added, DMFr: fructose added) at 25 ( ) and 35 (
 ) °C after 7 days of fermentation by LB672. Values are presented as mean ± standard error (n = 4). Different superscript lowercase letters represent significant difference between the carbon sources at either 25 or 35 °C according to Tukey’s test at p < 0.05.

