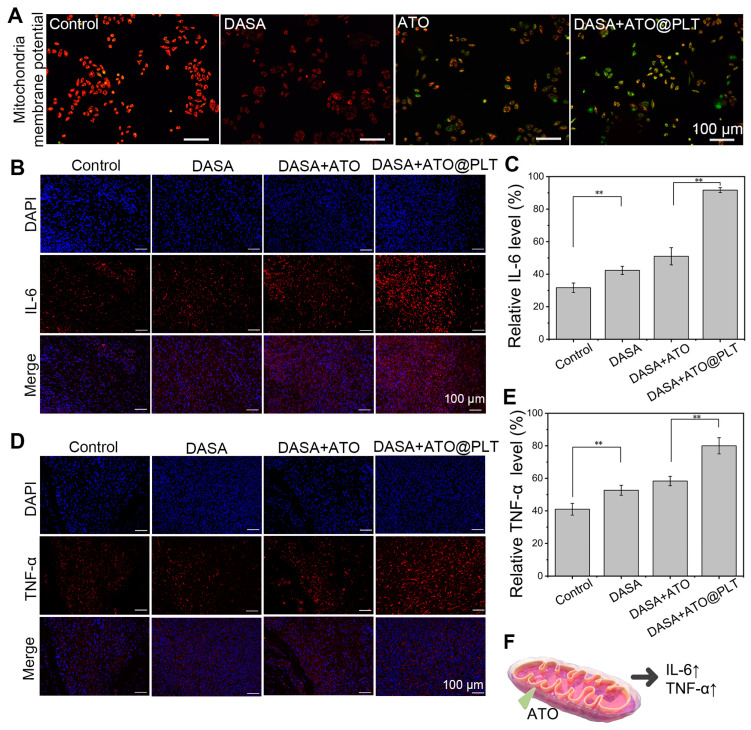
Figure 3.
Remodeled tumor microenvironment results of DASA+ATO@PLT: (A) the changes in mitochondrial membrane potential in vitro as detected by JC-1. Red: Normal membrane potential; Green: Mitochondrial membrane potential depolarization; (B) fluorescence expression of pro-inflammatory cytokines IL-6 in vivo. DAPI: Blue; IL-6: Red; Merge: Blue + Red; (C) statistical analysis of IL-6 expression levels; (D) fluorescence expression of pro-inflammatory cytokines TNF-α in vivo. DAPI: Blue; IL-6: Red; Merge: Blue + Red; (E) statistical analysis of TNF-α expression level; and (F) schematic illustration of ATO suppressing mitochondrial function, inducing elevated levels of IL-6 and TNF-α. ** p < 0.01.

