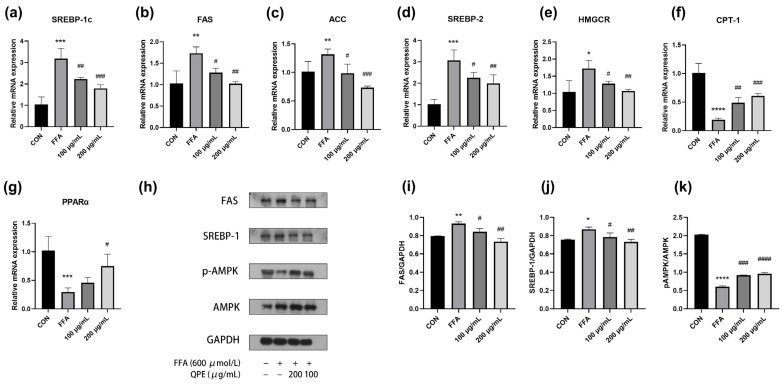
Figure 3.
(a–g) RT-PCR was conducted to detect relative mRNA expressions of genes responsible for lipid metabolism in HepG2 cells. (h) The protein expressions of FAS, SREBP-1c, p-AMPK and AMPK in HepG2 cells were detected by Western blot. (i–k) The gray analysis was analyzed by ImageJ 1.54 software. Data are presented as means ± SD (n = 3), * p < 0.05, ** p < 0.01, *** p < 0.001, **** p < 0.0001 compared to control group and # p < 0.05, ## p < 0.01, ### p < 0.001, #### p < 0.0001 compared to model group.

