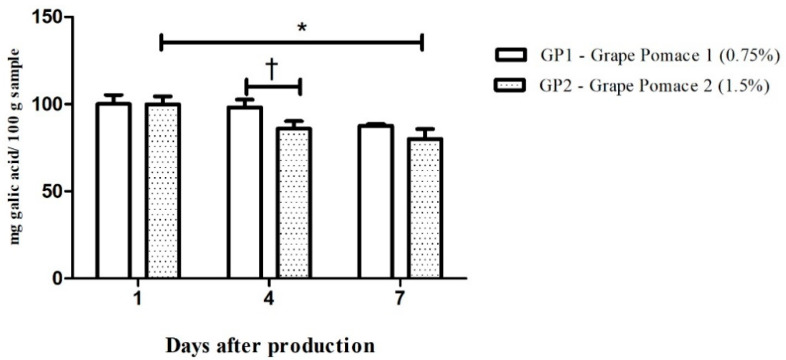
Figure 2.
Evaluation of the phenolic compound content in chow enriched with 0.75% (white bars) or 1.5% (dot bars) of grape pomace. Values are expressed as means ± SD (n = 5). Comparisons were conducted using one-way analysis of variance (ANOVA), followed by Tukey’s post hoc test. * p < 0.05 vs. Grape Pomace 1 (0.75%) day 1; † p < 0.05 vs. Grape Pomace 2 (0.75%) day 4.

