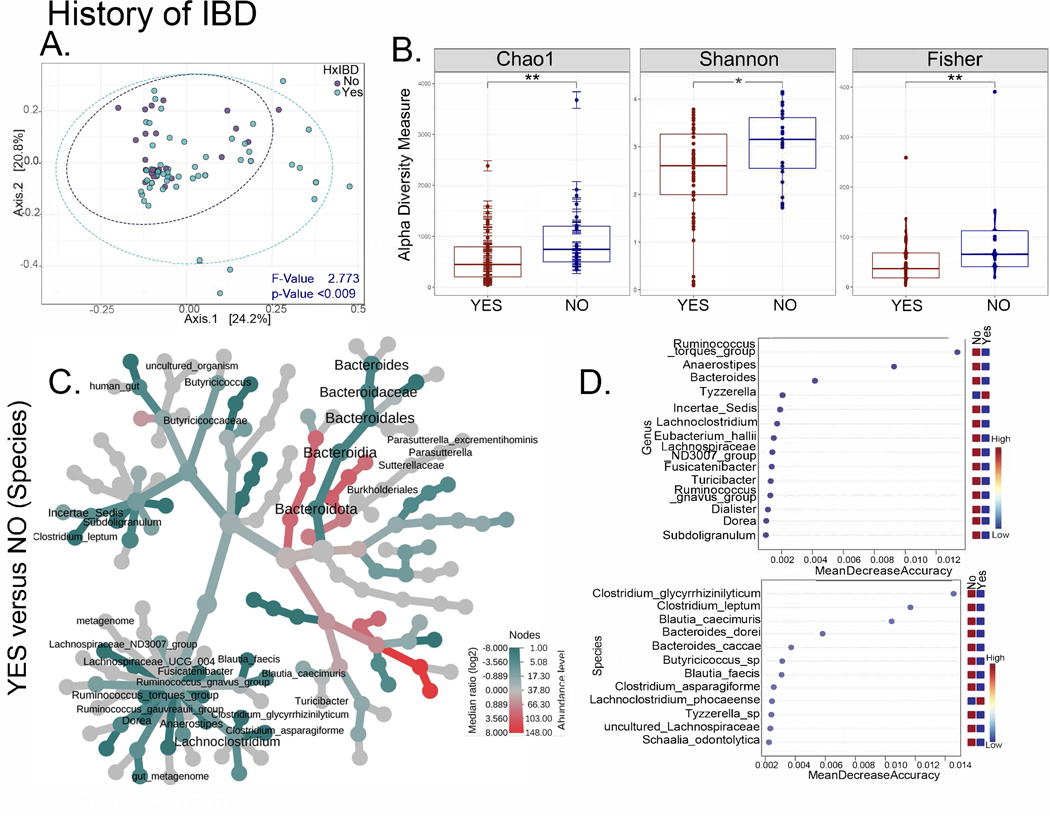
Figure 4. The intestinal microbiome distinguishes patients with CGD and a history of IBD.
(A-D) Comparisons for the NIH CC CGD group with or without the history of IBD (Yes n=54, No n=25). (A) PCoA plots of beta diversity based on weighted Unifrac distances for the two comparison groups with p values determined by permutational MANOVA (PERMANOVA, p<0.009). (B) Alpha diversity plots (Chao1, Shannon, Fisher; * = p<0.05, **=p<0.01) comparing patients with CGD, with and without a history of IBD. (C) Heat tree depicting phylogenetic relationship and significant differential abundance (p<0.05) of bacterial genera for the comparison groups. (D) Random forest plots where genera and species with highest discriminatory power between patients with CGD with vs. without a history of IBD are shown (red = high abundance, blue = low abundance).

