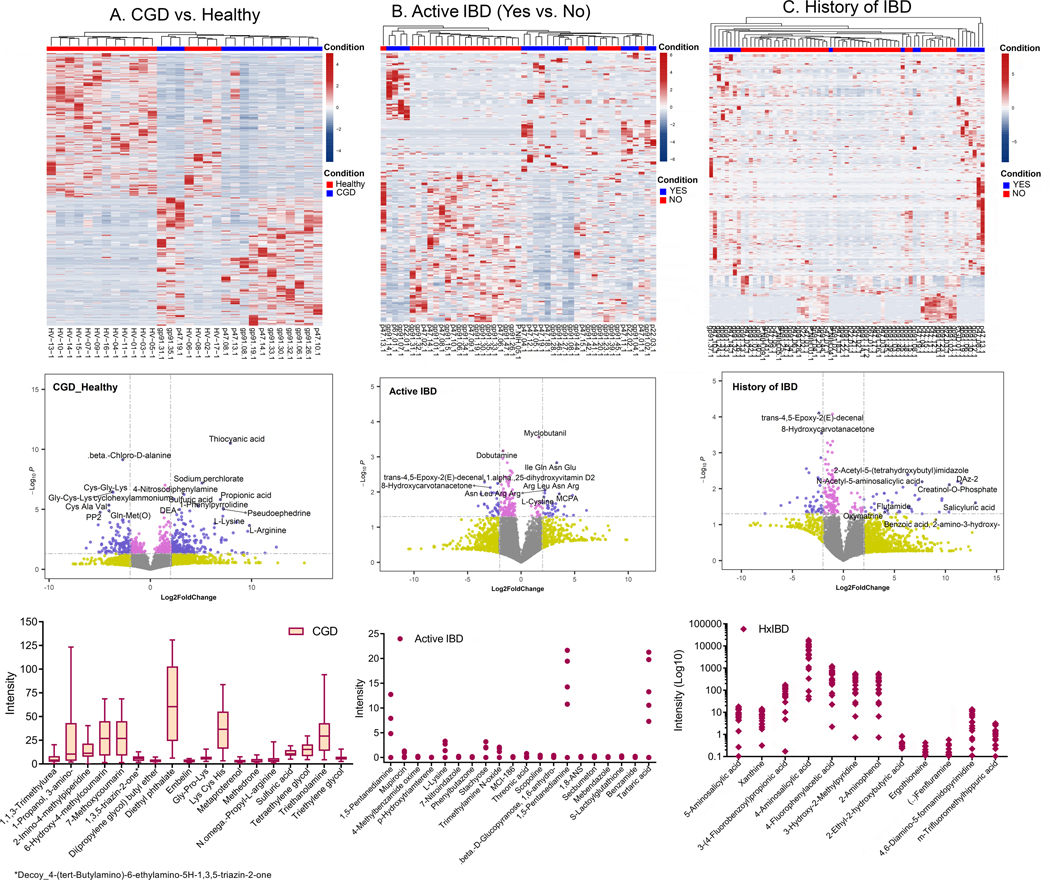
Figure 7. Distinct metabolome profiles in patients with CGD from the NIH CC cohort.
Top to Bottom: Heatmap of the metabolomic profile, volcano plot displaying high metabolic diversity between the comparison groups, and the plots for the intensity measurements of the metabolites that are expressed only in the indicated groups, which are potential biomarkers. (A) Comparison of CGD group (without a history of IBD and only on prophylactic antimicrobials, n=14) to Healthy (n=16), (B) comparison within the CGD group of those with (Yes n=30) vs. without active IBD (No n=36), and (C) comparison within the CGD group of those with (Yes n=50) vs. without a history of IBD (No n=19). In the heatmaps, the rows display the metabolites and the columns represent the samples (blue = decreased, red = increased). The brightness of each color corresponds to the magnitude of the difference when compared with the average value. The lines in the volcano plots indicate the significance cut-off for the p-value (-log10 P value of 1.3013 corresponding to p<0.05) and fold change (log2 Fold Change >2, log2 Fold Change <−2). All metabolites that are significant and over an absolute log2 Fold Change of 2 are shown in violet and those that are significant but have an expression change less than an absolute log2 Fold Change of 2 are shown in pink. The bar plot indicates metabolites identified only in the CGD group, the dot plot indicates metabolites identified only in CGD patients with active IBD, and the diamond plot indicates metabolites identified only in patients with CGD and a history of IBD.

