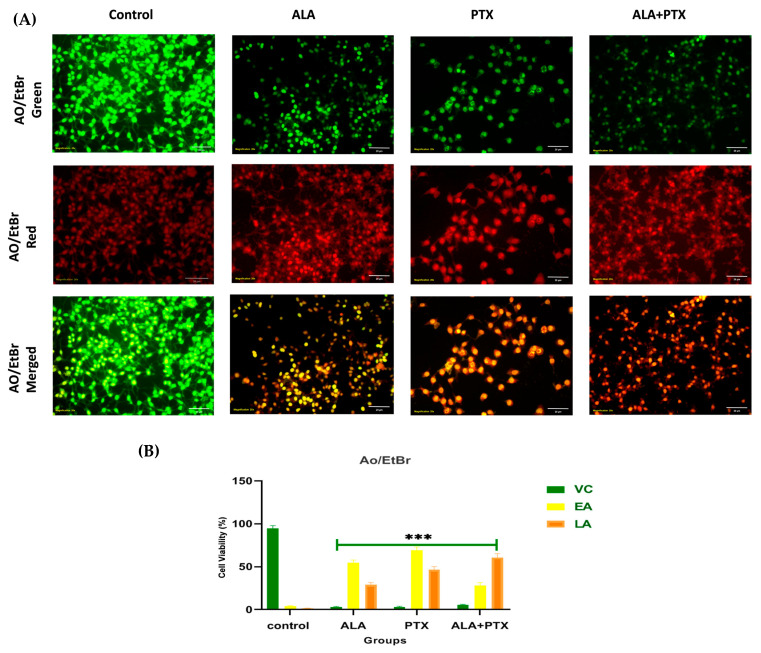
Figure 8.
(A) The figure illustrates apoptotic morphological changes in MCF-7 cells stained with AO/EtBr. Additionally, treatment with PTX-Lipo, ALA-Lipo, and ALA-PTX-Lipo in AO/EtBr staining revealed early apoptotic regions marked by yellow areas and late apoptotic nuclei appearing bright orange compared with the control group. (B) The quantitative data also showed notable variations among groups. VC: viable cells; LA: late apoptosis. An inverted fluorescent microscope with 20× magnification was used for capturing the pictures. Statistical significance was determined at *** p < 0.001, and comparisons were made with the control.

