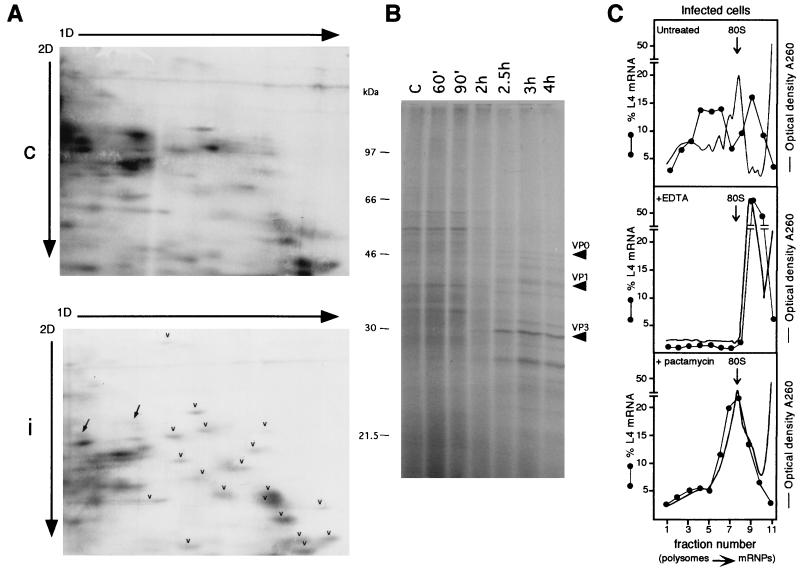
FIG. 3.
Analysis of the activity of polysome-associated RNA in infected cells by metabolic labeling of proteins and by EDTA and pactamycin treatment. (A) HEp-2 cells were grown and infected as described in the legend to Fig. 1. At 90 min postinfection, mock-infected and infected cells were incubated for 30 min with [35S]methionine-[35S]cysteine (Pro-mix; Amersham; >1,000 Ci/mmol) at a concentration of 0.1 mCi/ml. Cells were harvested in phosphate-buffered saline and homogenized in 0.5 ml of ice-cold rp buffer (0.1 M NaCl, 1 mM MgCl2, 10 mM HEPES, pH 7.5), acid extracted (58), and processed by the 2D gel electrophoresis method optimized to resolve r proteins, with the exception that the second-dimension (2D) gel was 13% polyacrylamide (58). A 200-μg sample of r proteins purified from HEp-2 ribosomes (58) was added as markers to an equal amount of control (c) or infected-cell (i) protein extract (200 μg). Gels were fluorographed and exposed to X-ray film for the same time. Arrowheads point to some r proteins, and arrows point to non-r proteins. 1D, first dimension. (B) HEp-2 cells, grown and infected as indicated above, were labeled with Pro-mix (40 μCi/ml) for 10 min at the indicated times after infection. Cells were lysed as described above, and 5 μg of each extract was loaded onto an SDS–12.5% PAGE gel and autoradiographed. Arrows point to viral proteins. Lane C, control. (C) Untreated infected cells (top) were lysed at 4 h postinfection and analyzed on a sucrose gradient as described in the legend to Fig. 1. For the EDTA treatment (middle), cytoplasmic extracts, brought to a concentration of 50 mM EDTA, pH 7.4, were incubated in ice for 5 min, loaded onto sucrose gradients containing 10 mM EDTA instead of magnesium, and analyzed as described in the legend to Fig. 1. To test the effect of pactamycin (bottom), cells were incubated at 3.5 h after infection with 30 ng of pactamycin per ml for 30 min, thus reaching the 4-h infection time of untreated cells, and then processed as described in the legend to Fig. 1. When the gradient fractions were collected, the optical density at 260 nm was monitored. The profiles are shown as a continuous line, and the 80S monomers are indicated by the arrows. Northern blots were hybridized with an rp-L4 probe. Measurement of radioactivity, reported as a percentage of the mRNA in each fraction, was done by PhosphorImager (Molecular Dynamics) analysis.

