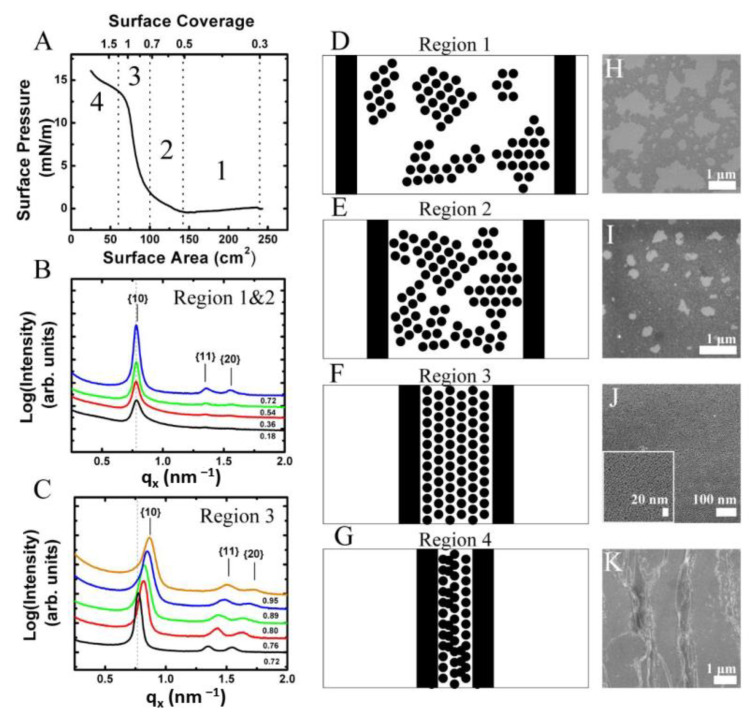
Figure 3.
Nanocrystal LB films deposited at different surface pressures. (A) Surface pressure–area isotherm of 7.14 ± 0.54 nm oleic acid stabilized Fe2O3 nanocrystals on a Langmuir–Blodgett trough. The film was compressed at 10 mm/min. A total of 300 µL of a 0.5 mg/mL dispersion of Fe2O3 nanocrystals dispersed in chloroform was deposited onto an area of 250 cm2. Vertical dashed lines mark the regions of the isotherm corresponding to the gas (1), liquid (2), solid (3), and collapse (4) phases. The upper x-axis denotes the surface coverage of Fe2O3 nanocrystals. (B) GISAXS performed on Fe2O3 nanocrystals films at the air–water interface over a surface coverage range of 0.18–0.72 which correspond to gas and liquid phases (regions 1 and 2) of the isotherm. (C) GISAXS scattering performed on Fe2O3 nanocrystals films at the air–water interface during compression over a surface coverage range of 0.72 to 0.95 which correspond to solid phase (region 3) of the isotherm. The graphs are projection integrations of GISAXS scattering images taken at various surface coverages on the air–water interface. The edge-to-edge separation between nanocrystals remains at 2.1 nm as the surface coverage increases from 0.18 to 0.72 during nanocrystal deposition and decreases from 2.1 nm to 1.3 nm over a surface coverage of 0.72 to 0.95. (D–G) are schematic illustrations of nanocrystal assembly at the air–water interface within the regions denoted in panel (A). A top-down view of the LB trough is depicted. Black circles correspond to Fe2O3 nanocrystals and vertical black bars correspond to the trough barriers. For simplicity, the ligands on the surface of the nanocrystal were not drawn. (H–K) SEM images of vertically transferred films at surface pressures of (H) 0 mN/m, (I) 1 mN/m, (J) 12 mN/m, and (K) 16 mN/m. SEM images are placed adjacent to corresponding film morphologies depicted in images (D–G).

