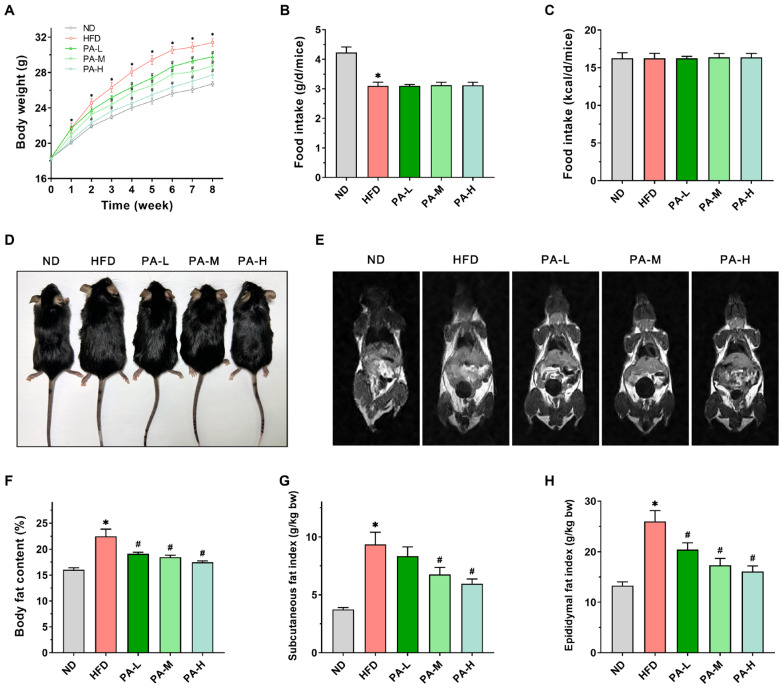
Figure 2.
Effects of PA on body weight and fat accumulation in HFD-induced mice. (A) Body weight changes from week 0 to week 8. (B) Daily food intake per mouse in grams. (C) Daily energy intake per mouse. (D) Representative photos of the mice after 8 weeks. (E) Representative coronal sections of MRI studies. (F) Body fat percentage in mice. (G) Subcutaneous fat mass index. (H) Epididymal fat mass index. Results are expressed as mean ± SEM. n = 8 per group. * p < 0.05, HFD vs. ND; # p < 0.05, HFD vs. PA-L, PA-M, or PA-H.

