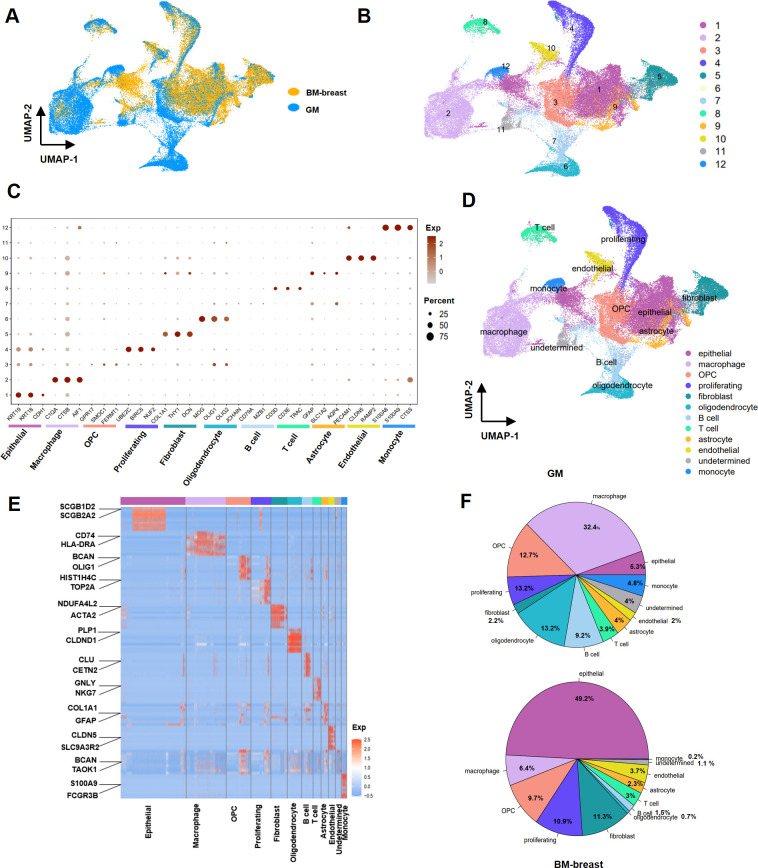
Fig 4. Transcriptional landscape of BM-breast and GM using 69,785 cells.
(A) UMAP plot displaying 69,785 cells from 12 samples of BM-breast and GM, color-coded according to their original datasets. (B) UMAP plot presenting 55,749 high-quality cells from 12 samples of BM-breast and GM, color-coded by their clusters. (C) Assignment of cell types to clusters based on gene marker expression patterns in BM-breast and GM. (D) Dot plots illustrating conserved and cell-type-specific markers in BM-breast and GM. (E) Heatmap of gene expression levels of top-ranking marker genes in 12 different clusters. (F) Pie charts representing the percentage of each cell type in BM-breast and GM.

