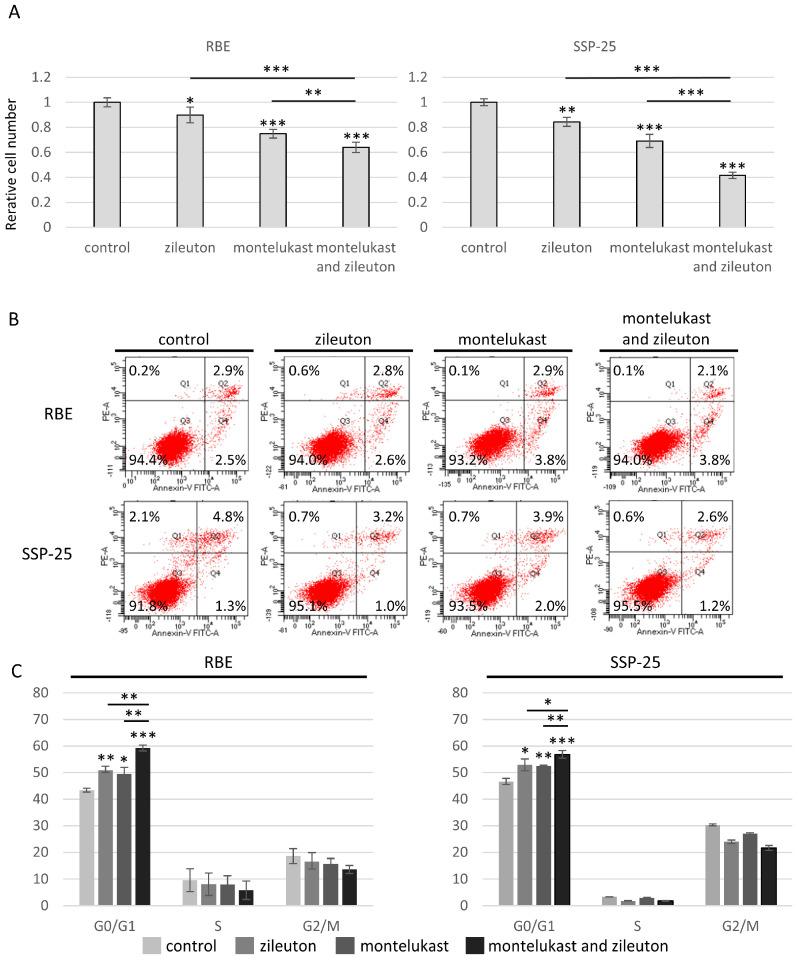
Figure 5.
Effects of co-administration of zileuton and montelukast on CCA cell lines. (A) Graphs of relative cell numbers compared with the control at 72 h quantified by a Cell Counting Kit-8 assay in high-CYSLTR1-expressing cell lines (RBE and SSP-25). Cells were treated with zileuton at 100 µmol/L and/or montelukast at 50 µmol/L for 72 h. Data are presented as mean ± standard deviation (n = 3 per group). Bars indicate standard deviation. * p < 0.05, ** p < 0.01, and *** p < 0.001. (B) RBE and SSP-25 cells were treated with 100 µmol/L zileuton and/or 50 µmol/L montelukast for 72 h and then stained with annexin-V FITC/PI. Apoptotic cells were evaluated using flow cytometry. Data represent the means of three independent experiments. (C) RBE and SSP-25 cells were treated with 100 µmol/L zileuton and/or 50 µmol/L montelukast for 72 h, and cell cycles were determined using flow cytometry. Data are presented as mean ± standard deviation (n = 3 per group).

