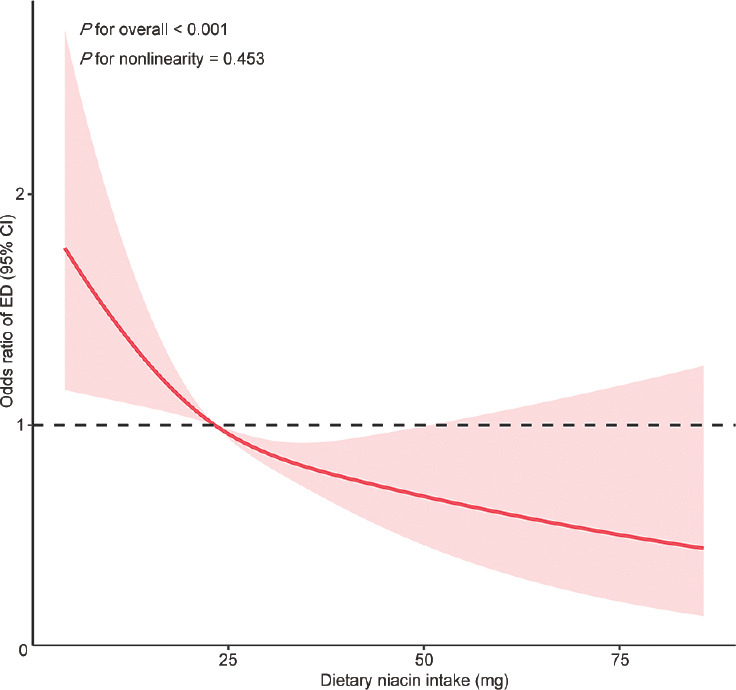
Figure 2.

Dose–response relationship analysis between dietary niacin intake and erectile dysfunction before PSM. RCS regression was adjusted for age, race, marital status, education level, PIR, BMI categories, recreational activity, smoking status, drinking status, total daily energy intake, CVD, hypercholesterolemia, hypertension, diabetes, as well as testosterone levels (Model 4). The red solid line represents ORs, and red-shaded region represents 95% CI. PSM: propensity score matching; ED: erectile dysfunction; CI: confidence interval; RCS: restricted cubic spline; BMI: body mass index; PIR: poverty-to-income ratio; CVD: cardiovascular disease; OR: odds ratio.
