

Abstract
The second-to-fourth digit (2D:4D) ratio is thought to be associated with prenatal androgen exposure. However, the relationship between the 2D:4D ratio and hypospadias is poorly understood, and its molecular mechanism is not clear. In this study, by analyzing the hand digit length of 142 boys with hypospadias (23 distal, 68 middle, and 51 proximal) and 196 controls enrolled in Shanghai Children’s Hospital (Shanghai, China) from December 2020 to December 2021, we found that the 2D:4D ratio was significantly increased in boys with hypospadias (P < 0.001) and it was positively correlated with the severity of the hypospadias. This was further verified by the comparison of control mice and prenatal low testosterone mice model obtained by knocking out the risk gene (dynein axonemal heavy chain 8 [DNAH8]) associated with hypospadias. Furthermore, the discrepancy was mainly caused by a shift in 4D. Proteomic characterization of a mouse model validated that low testosterone levels during pregnancy can impair the growth and development of 4D. Comprehensive mechanistic explorations revealed that during the androgen-sensitive window, the downregulation of the androgen receptor (AR) caused by low testosterone levels, as well as the suppressed expression of chondrocyte proliferation-related genes such as Wnt family member 5a (Wnt5a), Wnt5b, Smad family member 2 (Smad2), and Smad3; mitochondrial function-related genes in cartilage such as AMP-activated protein kinase (AMPK) and nuclear respiratory factor 1 (Nrf-1); and vascular development-related genes such as myosin light chain (MLC), notch receptor 3 (Notch3), and sphingosine kinase 1 (Sphk1), are responsible for the limitation of 4D growth, which results in a higher 2D:4D ratio in boys with hypospadias via decreased endochondral ossification. This study indicates that the ratio of 2D:4D is a risk marker of hypospadias and provides a potential molecular mechanism.
Keywords: androgen receptor, digit ratio (2D:4D), endochondral ossification, hypospadias, testosterone level
INTRODUCTION
Male congenital urogenital dysplasia is a serious global public health problem, and hypospadias (abnormal position of urethral orifice) is one of the most common malformations. In the past 30 years, the incidence of hypospadias in various regions was 0.2%–0.4%,1 and the number of affected individuals is on the rise. A large number of studies on hypospadias have focused on genetic factors, endocrine factors, and environmental factors. Although the exact etiology and pathogenesis of hypospadias remain unclear,2,3,4 most of these pathogenic factors play an important role in the development and progression of hypospadias by affecting androgens, especially testosterone levels, during pregnancy.5
During the human masculine programming window (MPW; 8–14 weeks of gestation), Leydig cells of the testis begin to secrete testosterone, which peaks at 14 weeks of gestation. During this period, insufficient testosterone production can hinder testicular descent, affecting the development of the penis and the formation of the urethra.6 Studies have shown that low testosterone levels during pregnancy due to many different genetic mutations can lead to the formation of hypospadias.7,8 In addition, the extensive use of chemical products in daily life, especially plasticizers, pesticides, and artificial feeds, affects the development of genitourinary organs by increasing estrogen-like substances in the environment and reducing testosterone levels during pregnancy.9,10 Blocking agents are also commonly used in pregnant rats and mice to induce hypospadias in offspring.11 However, due to technical difficulties, potential risks to the ongoing pregnancy, and other reasons, hormone levels during pregnancy are difficult to adequately assess, so some indicators representing prenatal androgen exposure are used. The second-to-fourth digit (2D:4D) ratio is generally considered a good surrogate for prenatal androgen exposure based on human cross-sectional studies and experimental animal studies.12,13,14
There are gender differences in the 2D:4D ratio, with women higher than men.15 Manning et al.13 first demonstrated in 1998 that 2D:4D is inversely correlated with testosterone concentrations during pregnancy. Subsequent studies also verified the relationship16,17 and found that the digit ratio was established early in embryonic development and then remained stable, not changing with age.18 Most studies in rodents also found that 2D:4D was inversely associated with testosterone levels during pregnancy, especially in the right hindlimb.19,20 Zheng and Cohn14 proved that 2D:4D is a lifelong signature of prenatal hormonal exposure and it correlates with numerous sexually dimorphic behavioral, physiological, and psychological conditions.
Although both digit ratio and hypospadias are associated with prenatal androgen exposure, there are few studies on the relationship, and the results are contradictory.6,21 Meanwhile, the molecular mechanism underlying the relationship between the digit ratio and hypospadias remains unclear. In a previous study, through whole exome sequencing analysis of 191 boys with severe hypospadias and 208 controls, a group of cilia-related outer dynein arm heavy chain (ODNAH) genes with rare damaging variants was found in 24% of patients with hypospadias. Dynein Axonemal Heavy Chain 8 (DNAH8)-knockout mice exhibited decreased prenatal testosterone levels, dysregulated steroid biosynthesis, and abnormal urethral development.22 Similar to human MPW, the window for androgen-promoted male genital tubercle differentiation in mice is 13.5–16.5 days of gestation.23 Meanwhile, the digit ratio was different at embryonic day 16.5 (E16.5) between male and female fetal mice.14 Therefore, our study aimed to determine the relationship between the 2D:4D ratio and hypospadias and its underlying molecular mechanism through the clinical data of patients with hypospadias and the DNAH8-knockout mouse model.
PARTICIPANTS AND METHODS
Study design and participants
This study included children with hypospadias who underwent hypospadias repair in Shanghai Children’s Hospital (Shanghai, China) from December 2020 to December 2021. A control group was composed of children without genital dysplasia (hernia, phimosis, or hydrocele) who were hospitalized at the same time. The recorded clinical data of the patients included the reason for the visit, admission time, age, sex, concurrent diseases, history of cryptorchidism, physical examination, and digit length. To minimize potential confusion and prejudice, we excluded patients with chronic diseases and diseases such as endocrine disease, trisomy, micropenis, buried penis, disorders of sexual differentiation, skeletal dysplasias, or polydactyly that might affect the development and growth of the digits or genitals. In addition, in the control group, we also excluded patients with a history of cryptorchidism. Finally, 142 children in the hypospadias group and 196 children in the control group were included in this study. In the hypospadias group, the degree of hypospadias was divided into three subgroups: proximal (penile scrotal type, scrotal type, and perineal type), middle (penile type), and distal (penile head, coronary groove, and subcoronal groove type) according to the position of the urethral orifice after full mobilization of the skin flaps during the operation.24 All procedures performed in studies involving human participants were conducted with the approval of the Ethics Committee of the Shanghai Children’s Hospital (Approval No. 2020R018-E01). Each patient was informed of the purpose of the study, and written consent forms were obtained from their parent/legal guardian.
Prenatal low testosterone exposure mouse model with hypospadias-related risk gene knockout
Based on our previous research, a prenatal low testosterone exposure mouse model with hypospadias-related risk gene (DNAH8) knockout built by clustered regularly interspaced short palindromic repeats-associated protein 9 (CRISPR-Cas9) technology was further used to study the 2D:4D ratio. Wild-type (WT) mice (C57BL/6, DNAH8+/+), heterozygous (HE) mice (C57BL/6, DNAH8+/−), and homozygous (HO) mice (C57BL/6, DNAH8−/−) were used. All animal handling and experimental procedures were carried out in accordance with the guidelines stipulated and approved by The Sixth People’s Hospital Affiliated to Shanghai Jiao Tong University Animal Ethics Committee (Shanghai, China; Approval No. DWSYHZ2020-002).
2D:4D data collection
To avoid unnecessary radiation to the children, we did not take X-rays of their hands but adopted the Vernier caliper measurement method after making a copy of their hands. The children were asked to place their hands on a standard photocopier, and then the researchers scanned both hands simultaneously. Digital images were captured and delivered electronically to the research team. The bilateral second and fourth digits were measured on the photocopies from the proximal crease of the palm to the fingertips. All measurements were performed twice, and the average value was used for analysis. For the measurement of the digit ratio in mice, we referred to the method used in previous studies.25,26 Take the right hindlimb of the mouse, palm up, and press it on a glass slide so that the digits are completely fixed and flat. The paws were then photographed under a Leica DM6 microscope (Leica Microsystems, Wetzlar, Germany). The 2D and 4D lengths of each paw were measured from the midpoint of the base of the digit to the tip of the digit, excluding the nail. Each paw was measured by two measurers and averaged.
Testosterone measurement
We obtained testes from E16.5 male fetal mice through surgical dissection, and the samples were ground with a KZ-III-F high-speed low-temperature tissue grinder (Servicebio, Wuhan, China) to obtain testicular homogenates. A testosterone enzyme-linked immunosorbent assay (ELISA) kit (Beyotime, Shanghai, China) was used to determine the testicular testosterone concentrations according to the instructions of the kit manufacturer. Briefly, antibodies that recognize testosterone with high specificity were precoated on the enzyme label plate, and the samples were added to the corresponding wells at 25 μl per well. Subsequently, the prepared horseradish peroxidase (HRP)-labeled testosterone was added at 75 μl per well. The reaction wells were mixed thoroughly for 10 s, sealed with sealing film (white), and incubated for 120 min at room temperature in the dark. Progesterone and HRP-labeled testosterone in the sample competitively bind to the antibody coated in the enzyme label plate, and then free testosterone and free HRP-labeled testosterone can be washed away. The HRP captured in the solid phase catalyzed the oxidation of colorless 3,3′,5,5′-tetramethylbenzidine (TMB) into a blue substance, which turned yellow after adding the termination solution. The absorbance value at 450 nm (A450 value) was measured immediately, and the testosterone concentration was inversely proportional to the A450 value. The standard curve was plotted, and the corresponding concentrations of the samples were calculated from the absorbance values of the samples and the standard curve. The measurements of testosterone levels were repeated three times.
Label-free quantitative proteomic bioinformatics analysis
Fetal male mice were obtained from E16.5 pregnant mice, and 2D and 4D tissues of the right hindlimb were obtained by dissection. For each sample, three technical replicates were analyzed. Liquid chromatography tandem-mass spectrometry (LC‒MS/MS) analysis, protein identification and quantification, and bioinformatics analysis were completed by Applied Protein Technology (APL, Shanghai, China). MaxQuant 1.6.14 software (Max Planck Institute of Biochemistry, Munich, Germany) was used to combine and search the original MS data of each sample using the label-free quantification (LFQ) method for the identification and quantitative analysis.
Western blot
Mouse right hindlimb 2D and 4D tissues were obtained and homogenized with 200 µl radio immunoprecipitation assay (RIPA) lysis buffer (Solarbio, Shanghai, China) for 30 s (for 1 ml lysate buffer, 100 µl 10× lysine [Bio-Rad, Hercules, CA, USA], 10 µl protease inhibitor [PI; Bio-Rad], and 1 µl phenylmethanesulfonyl fluoride [PMSF; 0.1 mol l−1 isopropanol; Bio-Rad]). After homogenization, the lysates were centrifuged at 15 000g (MicroCL 17; Thermo Fisher Scientific, Waltham, MA, USA) for 5 min at 4°C, the supernatant was taken, and the protein concentration was determined with the BCA Protein Quantification Kit (Yeasen, Shanghai, China), and then the samples were stored at −20°C. Proteins were transferred to polyvinylidene difluoride membranes (PVDF) by electrophoretic separation on 12.5% sodium dodecyl sulfate-polyacrylamide gel electrophoresis (SDS-PAGE). After transfer, the PVDF membranes were rinsed with Tris-Buffered Saline with Tween 20 (TBS-T; pH 7.6) and then blocked with 5% nonfat milk for 1 h. After washing 3 times for 5 min with TBS-T, the cells were incubated with the corresponding primary antibodies: antiandrogen receptor (AR; 1:1000 dilution, ab133273; Abcam, Cambridge, UK), antiestrogen receptor (ER)-α (1:1000 dilution, ab32063; Abcam), anti-Wnt family member 5a (Wnt5a0; 1:1000 dilution, ab229200; Abcam), and anti-Wnt5b (1:500 dilution, sc376249; Santa, Dallas, TX, USA). This was followed by three washes with TBS-T for 15 min, followed by incubation with HRP-labeled anti-rabbit IgG (1:5000, ab205718; Abcam) for 2 h at room temperature. Protein bands were visualized by an ECL western blot detection kit (Epizyme, Shanghai, China) and quantified by Image Labs (Bio-Rad). Rabbit anti-β-actin (1:2000 dilution, 4970S; CST, Danvers, MA, USA) was used as an internal control. Densitometric analyses of the Western blot bands were performed using an image analyzer system (NIH ImageJ 1.34, http://rsbweb.nih.gov/ij/).
Quantitative reverse transcription polymerase chain reaction (RT-qPCR)
Mouse right hindlimb 2D and 4D tissues stored in liquid nitrogen were ground with a KZ-III-F high-speed low-temperature tissue grinder (Servicebio), and total RNA was extracted using an RNeasy mini kit (QIAGEN, Dusseldorf, Germany). Contaminating DNA was removed from the RNA preparations using the RNase-free DNase Set (QIAGEN). Extracted RNA was quantified using an ND-1000 NanoDrop spectrophotometer (NanoDrop Technologies, Wilmington, DE, USA), and 1000 ng RNA was used for complementary DNA (cDNA) synthesis by the PrimeScript™ RT Reagent Kit (Takara, Kyoto, Japan). RT-qPCR was performed using TB Green® Premix Ex Taq™ II (Takara) on a QS7 Fast Real-Time PCR System (Thermo Fisher Scientific) according to the manufacturer’s instructions. A 20 μl reaction volume was used and the PCR cycling conditions were as follows: polymerase activation at 95°C for 30 s, followed by 40 cycles of denaturation at 95°C for 5 s and annealing at 60°C for 30 s. The samples were divided into three groups: WT, HE, and HO groups. Gene expression in each sample was tested in triplicate. Genotyping primer sequences: AR, 5′-TAA AGA CAT TTT GAA CGA GGC C-3′ (forward) and 5′-GTC AGA TAT GGT TGA ATT GCC C-3′ (reverse); ER-α, 5′-GAA CGA GCC CAG CGC CTA CG-3′ (forward) and 5′-TCT CGG CCA TTC TGG CGT CG-3′ (reverse); Wnt5a, 5′-GGA CGC TAG AGA AAG GGA ACG AAT C-3′ (forward) and 5′-GCC AGA CAC TCC ATG ACA CTT ACA G-3′ (reverse); and Wnt5b, 5′-GTC CTG ACT ACT GCC TGC GTA ATG-3′ (forward) and 5′- CCA TGC CCT CTG AGG TCT TGT TG-3′ (reverse). Glyceraldehyde-3-phosphate dehydrogenase (GAPDH) was used as an internal control to normalize the data and determine the relative expression levels of the target genes. The 2−ΔΔCt method was used to calculate the fold changes in gene expression.
5′-bromo-2′-deoxyuridine (BrdU) immunofluorescence
An appropriate amount of BrdU was dissolved in 1× phosphate buffer saline (PBS) to prepare a 10 mg ml−1 stock solution, sterilized by filtration, and injected intraperitoneally into the body of pregnant mice at an injection concentration of 100 mg kg−1 one night before treatment. On the 2nd day, the right hindlimb tissue of E16.5 fetal mice was collected, fixed with 4% paraformaldehyde overnight, and then washed with 70% ethanol. After fixation, the samples were dehydrated and embedded in paraffin for subsequent manipulation. Using the embedded specimen previously described, 6-µm-thick sections were cut using a paraffin-microtome (RM2235; Leica Biosystems, Nussloch, Germany). Sections were mounted on slides treated with polylysine, baked at 60°C for 8 h, deparaffinized in two changes of xylene for 5 min each, and then rehydrated in a graded series of alcohol. Slides were stained for BrdU according to the manufacturer’s protocols. The nuclei were stained simultaneously with 4′,6-diamidino-2-phenylindole (DAPI). All images were captured using an I8 microscope (Leica Microsystems). For BrdU analysis, BrdU-positive cells and total cells (visualized by DAPI) were counted in sections (n = 3).
Statistical analyses
Statistical analysis was performed using SPSS statistical software version 21.0 (SPSS Inc., Chicago, IL, USA) and Prism 9 (Prism 9 of GraphPad Software, Boston, MA, USA). A normal plot with a test and homogeneity of variance were used to determine whether the distribution of effect sizes between the groups was symmetric. Differences between groups were assessed by Student’s t-test, Mann–Whitney U test, or a variance test for continuous variables. Differences with P < 0.05 were considered statistically significant.
RESULTS
A total of 142 boys with hypospadias and 196 controls were ultimately included in our study. Their mean ages were 6.4 (range: 1.4–12.7) years and 3.5 (range: 1.0–12.0) years for the control and hypospadias groups, respectively. The data of the bilateral digits of the two groups of patients are shown in Table 1. The 2D:4D ratios (left, right, and mean) were all significantly higher in the hypospadias group (all P < 0.001). Due to the older age of the children in the control group, the bilateral single 2D and 4D lengths were significantly larger than those in the hypospadias group (all P < 0.001).
Table 1.
The baseline characteristics of participants in the control and hypospadias groups
| Variable | Control group (n=196) | Hypospadias group (n=142) | P |
|---|---|---|---|
| Age (year), mean (range) | 6.4 (1.4–12.7) | 3.5 (1.0–12.0) | <0.001*** |
| D2 left (mm), mean±s.d. | 50.69±8.25 | 42.06±7.91 | <0.001*** |
| D4 left (mm), mean±s.d. | 53.70±8.41 | 43.23±7.74 | <0.001*** |
| D2 right (mm), mean±s.d. | 50.60±8.38 | 41.55±7.70 | <0.001*** |
| D4 right (mm), mean±s.d. | 53.41±8.67 | 42.43±7.64 | <0.001*** |
| 2D:4D ratio (left), mean±s.d. | 0.94±0.41 | 0.97±0.43 | <0.001*** |
| 2D:4D ratio (right), mean±s.d. | 0.95±0.42 | 0.98±0.43 | <0.001*** |
| Mean 2D:4D ratio, mean±s.d. | 0.94±0.42 | 0.98±0.43 | <0.001*** |
***P<0.001, significant difference. D2: the second digit length; D4: the fourth digit length; 2D:4D ratio: the second-to-fourth digit ratio; s.d.: standard deviation
To exclude the impact of age-related changes in digit length on the 2D:4D ratio, we verified it in the control group. In the enrollment data, most of the children in the hypospadias group were within 4 years old, so we divided the control group into two subgroups with 4 years old as the boundary, as shown in Supplementary Table 1. In contrast, although the bilateral 2D and 4D lengths were significantly increased in the >4 years old group, there was no statistically significant difference in the 2D:4D ratio (all P > 0.05).
Supplementary Table 1.
Comparison of characteristics between age ≤4 and age >4 in the control group
| Variables | Age ≤4 (n=43) | Age >4 (n=153) | P |
|---|---|---|---|
| D2 left (mm) | 43.6±4.33 | 56.11±7.59 | <0.001*** |
| D4 left (mm) | 44.34±4.44 | 56.26±7.38 | <0.001*** |
| D2 right (mm) | 41.08±4.20 | 53.23±7.30 | <0.001*** |
| D4 right (mm) | 43.63±4.33 | 56.11±7.59 | <0.001*** |
| 2D:4D ratio (left) | 0.94±0.04 | 0.95±0.04 | 0.116 |
| 2D:4D ratio (right) | 0.94±0.04 | 0.95±0.04 | 0.337 |
| Mean 2D:4D ratio | 0.94±0.04 | 0.95±0.03 | 0.149 |
***Significant difference (P<0.001). D2: the second digit length; D4: the fourth digit length; 2D: 4D ratio: the second-to-fourth digit ratio
Furthermore, the 142 patients with hypospadias were divided into three subgroups (Supplementary Figure 1 (384.4KB, tif) ) according to severity, and the combined symptoms of these three groups are shown in Supplementary Table 2. As shown in Figure 1a, the mean 2D:4D ratios of the distal group, middle-segment group, and proximal group were 0.95, 0.97, and 0.99, respectively, with significant differences among the groups (all P < 0.01). Trend chart analysis showed that the 2D:4D ratio increased by 0.02 for each level of hypospadias severity (Figure 1b).
Supplementary Table 2.
The combined symptoms of three subgroups in hypospadias
| Groups | Distal | Middle | Proximal |
|---|---|---|---|
| Combined symptoms | n=23 | n=68 | n=51 |
| Preterm birth | 5 | 14 | 14 |
| Cryptorchidism | 3 | 3 | 9 |
| Hydrocele | 2 | 2 | 0 |
| Inguinal hernia | 0 | 1 | 0 |
| Sexual dysplasia | 0 | 0 | 9 |
Figure 1.

Ontogeny of the 2D:4D ratio. (a) Mean 2D:4D ratio according to severity of hypospadias patients (distal hypospadias, n = 23; middle hypospadias, n = 68; and proximal hypospadias, n = 51). (b) Mean 2D:4D ratio trend analysis of hypospadias patients with three severity groups. (c) 2D:4D ratio of right hindlimb in each group in the mouse model (n = 12 for each group). (d) Comparison of 2D digit length in each group in the mouse model. (e) Comparison of 4D digit length in each group in the mouse model. Error bars are ± s.d. *P < 0.05, **P < 0.01, and ***P < 0.001. NS: no significance; 2D: the second digit length; 4D: the fourth digit length; 2D:4D ratio: the second-to-fourth digit ratio; WT: wild-type mice; HE: heterozygous mice; HO: homozygous mice; s.d.: standard deviation.
In animal models, to better measure the digit length, we selected adult mice (7 weeks old) with longer digits. Twelve mice were observed in each of WT, HE, and HO groups. As shown in Figure 1c, the 2D:4D ratios of the WT, HE, and HO groups were 0.96, 0.98, and 1.00, respectively, with significant differences among the groups (all P < 0.01).
To further determine which digit determines the change in the 2D:4D ratio, we selected children in the control and hypospadias groups with the same age (3-4 years old), as shown in Supplementary Table 3. No differences were found in 2D length (both P > 0.05), and the increased 2D:4D ratio (both P < 0.01) in the hypospadias group was mainly due to the shortening of 4D. The same phenomenon was also observed in mice (Figure 1d and 1e). There was no difference in the length of 2D on the right hindlimb among the WT, HE, and HO groups (all P > 0.05). In contrast, 4D of HE and HO groups was significantly shortened compared with the WT group (both P < 0.01), especially in the HO group (P < 0.001).
Supplementary Table 3.
Comparison of characteristics between the control and hypospadias groups aged 3–4
| Variables | Control (n=22) | Hypospadias (n=16) | P |
|---|---|---|---|
| Age (year) | 3.60±0.40 | 3.50±0.40 | 0.242 |
| D2 left (mm) | 43.90±4.23 | 43.06±3.46 | 0.519 |
| D4 left (mm) | 46.63±3.86 | 43.51±3.48 | 0.015* |
| 2D:4D ratio (left) | 0.94±0.04 | 0.99±0.03 | <0.001*** |
| D2 right (mm) | 43.22±4.27 | 42.52±3.77 | 0.602 |
| D4 right (mm) | 45.79±3.77 | 43.05±3.46 | 0.028* |
| 2D:4D ratio (right) | 0.94±0.04 | 0.99±0.04 | 0.002** |
*Significant difference (P<0.05); **Significant difference (P<0.01); ***Significant difference (P<0.001). Data are shown as mean±SD. D2: the second digit length; D4: the fourth digit length; 2D: 4D ratio: the second-to-fourth digit ratio; s.d.: standard deviation
Compared to the WT mice at E16.5, intratesticular testosterone levels were decreased in the HE mice (P < 0.05) and more significantly decreased in the HO mice (P < 0.01), as shown in Figure 2a. Furthermore, we used label-free quantitative mass spectrometry to identify the differentially expressed proteins and biological processes (Figure 2b–2d and Supplementary Figure 2 (943.4KB, tif) ). Among all combinations, significant developmental-related biological process changes were observed only in the 4D comparison between the HO and WT groups. A total of 128 differentially expressed proteins were detected (fold change >2 and P < 0.05) in 4D of the HO mice compared with WT mice, with 23 upregulated and 105 downregulated. Multiple significant developmental-related biological processes (all P < 0.05) were found to be involved in the differentially expressed proteins between 4D of the HO and WT groups by GO biological process analysis, including embryonic limb morphogenesis, embryonic appendage morphogenesis, limb morphogenesis, appendage morphogenesis, limb development, and appendage development.
Figure 2.

Testosterone measurement and proteomics analysis of the mouse model. (a) Intratesticular testosterone levels as measured by ELISA in WT, HE and HO mice at E16.5, n = 3 for each group. (b) A total of 128 differentially expressed proteins were detected (fold change > 2 and P < 0.05) in the 4D of HO mice compared with WT mice, of which 23 were upregulated and 105 were downregulated. (c) Heatmap of differentially expressed proteins between the WT and HO groups via a hierarchical clustering algorithm. (d) Label-free quantitative mass spectrometry-based proteomics demonstrated that HO group mice significantly dysregulated the biological process of limb and appendage morphogenesis or development biosynthesis. Data in graphs are presented as mean ± s.d. *P < 0.05, **P < 0.01. WT: wild-type mice; HE: heterozygous mice; HO: homozygous mice; s.d.: standard deviation; ELISA: enzyme-linked immunosorbent assay; E16.5: embryonic day 16.5; ERBB: originally named because of their homology to the erythroblastoma viral gene product, also known as human epidermal growth factor receptor; 4D: the fourth digit length.
We further examined the key gene and protein levels of AR, ER, Wnt5a, and Wnt5b related to phalangeal development in 2D and 4D of fetal mice right hindlimb at E16.5. As shown in Figure 3a, in 4D, the AR and ER transcripts were significantly reduced in the HE and HO mice compared to the wild-type values, and it is worth noting that AR was significantly lower than ER (AR decreased by 22.1% and ER decreased by 15.3% in the HE group; AR decreased by 55.2% and ER decreased by 20.1% in the HO group); in addition, the Wnt5a and Wnt5b transcripts showed significant opposite trends in the HE and HO mice (Wnt5a increased by 11.2% and Wnt5b decreased by 27.3% in the HE group; Wnt5a increased by 67.3% and Wnt5b decreased by 44.2% in the HO group). However, in 2D, the levels of AR, ER, Wnt5a, and Wnt5b transcripts in the HE and HO mice were not significantly different from those in the wild-type (Figure 3b). In 2D and 4D, the same changes were observed in the protein levels of AR, ER, Wnt5a, and Wnt5b (Figure 3c and 3d). To deeply investigate whether there were other factors leading to changes in digit bone development, we further conducted Kyoto Encyclopedia of Genes and Genomes (KEGG) pathway and pathway enrichment analyses on differentially expressed proteins in 4D between the HO and WT groups. The results showed that differentially expressed proteins were mainly enriched in apelin signaling pathways (Figure 3e). To determine the mechanism of impaired phalangeal development caused by low testosterone levels, further study on the apelin signaling pathways was conducted (Supplementary Figure 3 (1MB, tif) ). Intriguingly, AMP-activated protein kinase (AMPK)/peroxisome proliferator-activated receptor-gamma coactivator-1 alpha (PGC-1a)/nuclear respiratory factor 1 (Nrf-1), transforming growth factor β (TGF-β)/Smad family member 2 (Smad2)/Smad3, and myosin light chain (MLC)/notch receptor 3 (Notch3)/sphingosine kinase 1 (Sphk1) were downregulated, and they were regarded as responsible for mitochondrial function in chondrocytes, chondrocyte proliferation, and embryonic angiogenesis and development.
Figure 3.

The changes in expression of AR, ER, Wnt5a, and Wnt5b in 2D and 4D in E16.5 fetal mice right hindlimb, as well as the KEGG enrichment analysis. (a) In 4D, AR and ER transcripts were significantly reduced in HE and HO groups compared to WT group (AR decreased by 22% and ER decreased by 15% in the HE group; AR decreased by 55% and ER decreased by 20% in the HO group); Wnt5a and Wnt5b transcripts showed significant opposite trends in the HE and HO groups (Wnt5a increased by 11% and Wnt5b decreased by 27% in the HE group; Wnt5a increased by 67% and Wnt5b decreased by 44% in the HO group). (b) In 2D, the levels of AR, ER, Wnt5a, and Wnt5b transcripts in the HE and HO were not significantly different from those in the WT group. (c) Protein expression detected by western blot in 2D and 4D of right hindlimb in WT, HE and HO groups. (d) Data are presented as relative intensities of AR, ER, Wnt5a, and Wnt5b proteins versus β-actin, respectively, as determined by ImageJ (n = 3). In 4D, compared with the WT, the AR of the HE and HO decreased significantly, while Wnt5a increased significantly. (e) KEGG enrichment analysis of 4D in the WT and HO groups, including the top 20 representative upregulated or downregulated pathways. Data in graphs are presented as mean ± s.d. *P < 0.05, **P < 0.01, and ***P < 0.001. NS: no significance; WT: wild-type mice; HE: heterozygous mice; HO: homozygous mice; 2D: the second digit; 4D: the fourth digit; AR: androgen receptor; ER: estrogen receptor; Wnt5a: Wnt family member 5a; Wnt5b: Wnt family member 5b; KEGG: Kyoto Encyclopedia of Genes and Genomes; s.d.: standard deviation; E16.5: embryonic day 16.5; TGF: transforming growth factor.
Then, we analyzed the proliferation of the 2D and 4D phalanges in the E16.5 period (Figure 4). In the WT control group, BrdU-positive cells were significantly more abundant in 4D than those in 2D. The effect of reduced testosterone levels on 4D was significantly greater than that on 2D. In 4D, compared with the WT group, the cell proliferation in the HE and HO groups was significantly reduced (both P < 0.001), but there was no significant difference in 2D (both P > 0.05). The significant decrease in 4D growth and the increase in the 2D:4D ratio can be explained by a decrease in chondrocyte proliferation.
Figure 4.

Cell proliferation of 2D and 4D. (a) BrdU immunolocalization (red) and DAPI staining (blue) of cross section of phalange of 2D and 4D of right hindlimb at E16.5 (scale bars = 50 µm). (b) Mitotic index calculated from 2D slices (n = 3). (c) Mitotic index calculated from 4D slices (n = 3). The effect of reduced testosterone level on 4D is significantly greater than that on 2D. Data in graphs are presented as mean ± s.d. ***P < 0.001. NS: no significance; BrdU: 5′-bromo-2′-deoxyuridine; DAPI: 4′,6-diamidino-2-phenylindole; 2D: the second digit; 4D: the fourth digit; WT: wild-type mice; HE: heterozygous mice; HO: homozygous mice; s.d.: standard deviation; E16.5: embryonic day 16.5.
DISCUSSION
As a reliable prenatal testosterone exposure indicator, the 2D:4D ratio has been proposed for the assessment of hypospadias in recent years. However, there are few studies correlating the two, and the results are conflicting.6,21 Previous studies have compared the four commonly used measurement methods of the human digit ratio and concluded that fingertip soft tissue has no effect on the digit ratio or the gender differentiation it represents. The Vernier caliper measurement after photocopying that we selected, which is intuitive, efficient, and noninvasive, has become a mainstream measurement method.27,28 Meanwhile, the 2D:4D ratio becomes stable in humans and mice during the MPW and does not change with age, so any difference in age does not affect the 2D:4D ratio.14,29 Our study of clinical pediatric data showed a significant increase in the digit length ratio in the hypospadias group compared to the control group. Further classification according to severity revealed significant differences in the digit ratio between the distal, mid, and proximal hypospadias groups, and the digit ratio increased with the severity of hypospadias. Previous studies5,6,8,9,10,11,30 have shown that hypospadias are usually caused by low testosterone exposure during pregnancy for various reasons, and lower testosterone levels are more likely to produce severe urogenital abnormalities, so we hypothesized that the correlation between the digit ratio and hypospadias was caused by differences in androgen levels during a common early programming window of prenatal development. Direct regulation of human fetal sex hormone levels is unethical, and most human studies typically analyze these hormones in the second or third trimester, whereas the critical period for 2D:4D development occurs in the first trimester.31 Studies have shown that the developmental basis of 2D:4D is similar in mice, rats, and humans,32 so the prenatal low testosterone exposure mouse model with hypospadias-related risk gene (DNAH8) knockout was selected as the experimental subject. With the decrease in prenatal testosterone levels, there was a corresponding significant increase in the digit ratio of mice.
We found that the differences in 2D:4D ratios in clinical children and mice were both caused by changes in 4D. Moreover, the proteomics results of E16.5 fetal mouse digits verified that in androgen-dependent MPW, low testosterone levels hindered the development of 4D more than 2D. Therefore, 4D is relatively shorter in patients with hypospadias, resulting in a larger 2D:4D ratio. In an elegant study by Zheng and Cohn,14 the cause of the difference in the 2D:4D ratio between the sexes was reported for the first time in animal experiments. They found that this difference was because 4D has higher levels of AR as well as ER than 2D, and these receptors are more active, especially AR, which influences the 2D:4D ratio by modulating osteogenic gene expression and apoptosis levels in 4D. Another recent study found an increased 2D:4D ratio in the right hindlimbs of overall AR-overexpressing mice compared with WT and neural-specific AR-overexpressing mice regardless of sex.33 Their results showed that nonneural AR plays an important role in 2D:4D development. Enhancing androgen sensitivity by increasing AR is sufficient to increase the masculinization of digit ratio.33 Our results are consistent with the above studies. At E16.5, AR protein expression in fetal mouse 4D was significantly higher than that in 2D, and with the decrease in testosterone level, AR transcriptional activity and protein expression in 4D were significantly reduced. In addition, AR expression is not the same in all tissues and organs during development.34,35 Our results showed that in the window of mouse male genital tubercle differentiation23, prenatal low testosterone levels led to a significant decrease in AR protein and transcript levels in fetal mouse 4D and testicular tissue. This interesting similarity is the basis for the correlation between the digit ratio and hypospadias.
AR is very important in bone development, and AR expression is found in bone marrow mesenchymal stem cells (BMSCs), osteoblasts, and osteocytes.36,37 A series of studies have shown that some genes are regulated by androgen-AR and thus play an important role in digit development.38,39,40 Zheng and Cohn14 found that in mice, 19 skeletal-related genes were altered in 4D compared to 2D after treatment with flutamide to reduce AR,14 and we were interested in the upregulation of Wnt5a transcript levels. The Wnt signaling pathway is very important for fetal growth and plays different regulatory roles in the development of various organs and tissues.41,42 For example, it is regulated by sex hormones to guide the proliferation and elongation of the penis during the process of differentiation,43,44 and it participates in the regulation of chondroprogenitor cells in the growth plate.45
In the earliest studies on bird digits, three members of the Wnt signaling pathway, the ligand Wnt5a, the frizzled-4 receptor (FZ4), and the Wnt antagonist frizzled related protein-1 (FRZB1) were found to be involved in the formation and differentiation of digits.46,47,48 Wnt5a also plays a key role in mouse digit development. At embryonic stage E12.5 of mouse embryos, the transcription factor SRY box transcription factor 9 (Sox9) begins to appear, heralding the formation of metacarpal/metatarsal bones and the subsequent phalanges,49 while Wnt5a mesenchymal expression in the developing limb buds before E12.5 has already begun.50 Previous studies have demonstrated that during embryonic digit development in vivo, Wnt5a not only regulates limb growth through Wnt/planner cell polarity (PCP) signaling51 but also regulates chondrogenesis through Ca2+–calcineurin–nuclear factor of activated T cells (NFAT) signaling to promote the ability of cells to initiate chondrogenesis.52 Bone formation can occur through two different pathways, namely, endochondral ossification and intramembranous ossification, and the formation of phalanges is an endochondral ossification.53 In fetal mice, all interphalangeal joints are activated at E14.5, and the various bone elements are divided. These cells continue to grow independently, forming growth plates and undergoing endochondral ossification.54
A recent study reported that in the formation of phalanges, Wnt5a generates the necessary tissue scale, anisotropy, and active stress to form a crescent-shaped compressive stress region (digit crescent, DC), which is essential for digit formation and phalangeal elongation,55 promotes localized hyperactive protein expression that defines the center of the digit tissue, and in turn induces Sox9 expression and maintains digit formation.56 Although Wnt5a is necessary for the growth of digit phalanges, excessive Wnt5a also plays an inhibitory role. Yang et al.57 reported that the balance of Wnt5a and Wnt5b coordinated chondrocyte proliferation and differentiation and that overexpression of Wnt5a prevented the transition of quiescent chondrocytes (zone I) to highly proliferative chondrocytes (zone II), resulting in delayed longitudinal growth of long bones. This was confirmed by the gene and protein levels of Wnt5a and Wnt5b observed in 2D and 4D of E16.5 fetal mice in our study and a significant Wnt5a/Wnt5b imbalance in 4D of prenatally low testosterone mice compared to WT mice.
Furthermore, KEGG pathway and pathway enrichment analyses showed that the 4D differential proteins in the WT and HO groups were mainly enriched in the apelin signaling pathway. Apelin is a polypeptide hormone produced by adipocytes, endothelial cells, and cardiomyocytes, and the apelin signaling pathway is a multifunctional signal transduction mechanism that plays an important physiological and pathological role in angiogenesis, energy metabolism, and osteogenic differentiation.58,59 Further study of the apelin signaling pathway found that some key genes (AMPK, NRF-1, Smad2, Smad3, MLC, Notch3, and SphK1) were downregulated. Studies have shown that the activation of the AMPK/PGC-1α/NRF-1 pathway can reverse chondrocyte mitochondrial biogenesis ability,60 and the specific destruction of NRF-1 in bone tissue leads to abnormalities.61 In view of this, the downregulation of AMPK and NRF-1 leads to a decline in chondrocyte mitochondrial function and affects the proliferation and growth of chondrocytes. In addition, mouse genetic studies have shown that the TGF-β-Smad2/3 signaling pathway plays an important role in cartilage formation,62 which seems to be a digit development-inducing signal that can subsequently activate bone morphogenetic protein (BMP)-Smad1/5/8 signaling and act on the DC region.63 Meanwhile, Smad2 and Smad3 were more highly expressed in the proliferative cartilage region than in the quiescent cartilage region.64 Therefore, downregulated Smad2/3 can reduce the proliferation of cartilage during phalangeal development. More importantly, osteogenesis and angiogenesis are two closely related processes in bone growth, development, remodeling, and repair.65 During the process of endochondral ossification, vascular invasion and chondrocyte proliferation occurs in a coordinated process, thereby elongating the bone.66 Downregulated MLC, Notch3, and SphK1 are all related to angiogenesis and development, especially Notch3. A study has shown that Notch3 is the target of Notch signal transduction, which can activate the differentiation genes of vascular wall cells, positively regulate the proliferation of pericytes and promote the development of neovascularization.67 All of the above-mentioned gene regulation creates a developmental environment harmful to cartilage ossification of 4D phalanges.
Overall, we speculate that the development of 4D phalanges in low-testosterone mice is slowed, which was confirmed by BrdU staining. Compared with WT mice, a significant reduction in phalanx proliferation in prenatal low testosterone mice was revealed. The mechanism of the higher 2D:4D ratio in hypospadias is outlined in Figure 5. In brief, low testosterone levels during pregnancy resulted in hypospadias and impaired phalangeal development at 4D. The decreased AR expression in 4D resulted in an imbalance of Wnt5a/5b, which prevented the transition from Zone I to Zone II. At the same time, the downregulated key genes AMPK, NRF-1, Smad2, Smad3, MLC, Notch3, and SphK1 in the apelin signaling pathway affected the function of chondrocyte mitochondria, chondrocyte proliferation, and angiogenesis, thus affecting cartilage ossification. All of these factors affect the longitudinal growth of 4D phalanges, resulting in a higher 2D:4D ratio.
Figure 5.
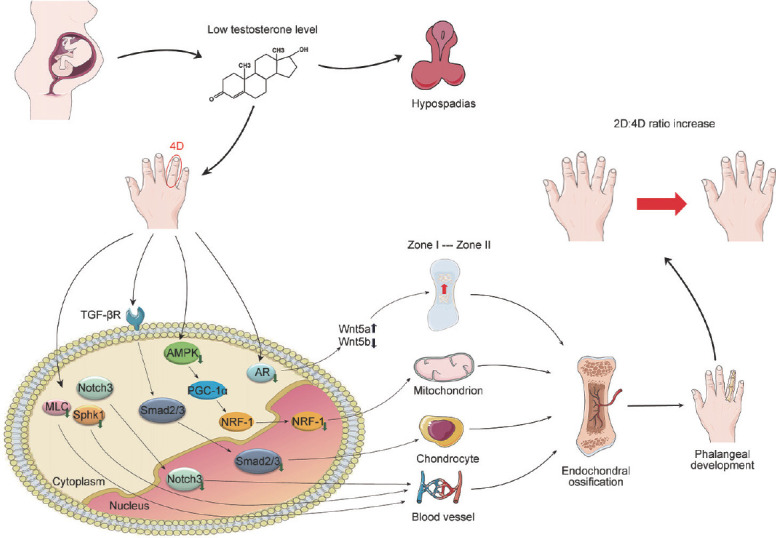
Potential mechanism in the development of a higher 2D:4D ratio. Signaling pathways of a higher 2D:4D ratio in hypospadias resulted by the limitation of 4D phalanges growth caused by low testosterone levels during pregnancy. 4D: the fourth digit; 2D:4D ratio: the second-to-fourth digit ratio; AR: androgen receptor; Wnt5a: Wnt family member 5a; Wnt5b: Wnt family member 5b; Smad2: Smad family member 2; Smad3: Smad family member 3; AMPK: AMP-activated protein kinase; NRF-1: nuclear respiratory factor 1; MLC: myosin light chain; Notch3: notch receptor 3; Sphk1: sphingosine kinase 1; PGC-1a: peroxisome proliferator-activated receptor-gamma coactivator-1 alpha; TGF-βR: transforming growth factor-β receptor.
In conclusion, the ratio of 2D:4D is associated with hypospadias and positively correlated with their severity. During the androgen-sensitive window of urethral development and masculine programming, low testosterone levels caused by genetic and environmental interactions not only cause hypospadias but also limit the growth of 4D by inhibiting endochondral ossification, which results in a higher 2D:4D ratio in association with hypospadias. This study’s findings suggest that the ratio of 2D:4D is a risk marker of hypospadias and provides a potential molecular mechanism. Since hypospadias cannot be detected during pregnancy, the observation of the 2D:4D ratio by ultrasound is a potential prediction method. The main limitation of this study is its relatively small sample size and lack of precise multivariate analysis. Meanwhile, in this study, although the digit ratio is not affected by age, it is better when the age of the controls matches that of the cases. Further prospective research is needed to improve these deficiencies.
AUTHOR CONTRIBUTIONS
ZZC and FC contributed to the study conception and design and supervised the whole study. MW, HX, YQL, and YCH recruited study subjects. ZQC performed data collection. YD and WFP completed the animal experiments. YD, ZQC, and HJC performed data analysis. YD was a major contributor in writing the manuscript. All authors read and approved the final manuscript.
COMPETING INTERESTS
All authors declare no competing interests.
Three subgroups according to the position of the urethral orifice after full mobilization of the skin flaps during the operation.
The topGO directed acyclic graph (DAG) shows the hierarchical relationship of enriched GO entries of differential proteins between the WT and HO groups. Changes in limb and appendage morphogenesis or development biosynthesis are included in the developmental process. WT: wild-type mice; HO: homozygous mice; GO: gene ontology.
Apelin signaling pathway maps between the WT and HO groups. WT: wild-type mice; HO: homozygous mice.
ACKNOWLEDGMENTS
This work was supported by the National Natural Science Foundation of China (Grant No. 81870459 and 81970572).
Supplementary Information is linked to the online version of the paper on the Asian Journal of Andrology website.
REFERENCES
- 1.Yu X, Nassar N, Mastroiacovo P, Canfield M, Groisman B, et al. Hypospadias prevalence and trends in international birth defect surveillance systems, 1980-2010. Eur Urol. 2019;76:482–90. doi: 10.1016/j.eururo.2019.06.027. [DOI] [PMC free article] [PubMed] [Google Scholar]
- 2.Chen Z, Lin X, Lei Y, Chen H, Finnell RH, et al. Genome-wide association study in Chinese cohort identifies one novel hypospadias risk associated locus at 12q13.13. BMC Med Genomics. 2019;12:196. doi: 10.1186/s12920-019-0642-0. [DOI] [PMC free article] [PubMed] [Google Scholar]
- 3.Chen Z, Lin X, Wang Y, Xie H, Chen F. Dysregulated expression of androgen metabolism genes and genetic analysis in hypospadias. Mol Genet Genomic Med. 2020;8:e1346. doi: 10.1002/mgg3.1346. [DOI] [PMC free article] [PubMed] [Google Scholar]
- 4.Brouwers MM, Feitz WF, Roelofs LA, Kiemeney LA, de Gier RP, et al. Risk factors for hypospadias. Eur J Pediatr. 2007;166:671–78. doi: 10.1007/s00431-006-0304-z. [DOI] [PubMed] [Google Scholar]
- 5.Matsushita S, Suzuki K, Murashima A, Kajioka D, Acebedo AR, et al. Regulation of masculinization:androgen signalling for external genitalia development. Nat Rev Urol. 2018;15:358–68. doi: 10.1038/s41585-018-0008-y. [DOI] [PubMed] [Google Scholar]
- 6.O’Kelly F, DeCotiis K, Zu’bi F, Farhat WA, Koyle MA. Increased hand digit length ratio (2D:4D) is associated with increased severity of hypospadias in pre-pubertal boys. Pediatr Surg Int. 2020;36:247–53. doi: 10.1007/s00383-019-04600-3. [DOI] [PubMed] [Google Scholar]
- 7.Sultan C, Paris F, Terouanne B, Balaguer P, Georget V, et al. Disorders linked to insufficient androgen action in male children. Hum Reprod Update. 2001;7:314–22. doi: 10.1093/humupd/7.3.314. [DOI] [PubMed] [Google Scholar]
- 8.Kothandapani A, Lewis SR, Noel JL, Zacharski A, Krellwitz K, et al. GLI3 resides at the intersection of hedgehog and androgen action to promote male sex differentiation. PLoS Genet. 2020;16:e1008810. doi: 10.1371/journal.pgen.1008810. [DOI] [PMC free article] [PubMed] [Google Scholar]
- 9.Kilcoyne KR, Mitchell RT. Effect of environmental and pharmaceutical exposures on fetal testis development and function:a systematic review of human experimental data. Hum Reprod Update. 2019;25:397–421. doi: 10.1093/humupd/dmz004. [DOI] [PMC free article] [PubMed] [Google Scholar]
- 10.Jin H, Yan M, Pan C, Liu Z, Sha X, et al. Chronic exposure to polystyrene microplastics induced male reproductive toxicity and decreased testosterone levels via the LH-mediated LHR/cAMP/PKA/StAR pathway. Part Fibre Toxicol. 2022;19:13. doi: 10.1186/s12989-022-00453-2. [DOI] [PMC free article] [PubMed] [Google Scholar]
- 11.Cunha GR, Sinclair A, Risbridger G, Hutson J, Baskin LS. Current understanding of hypospadias:relevance of animal models. Nat Rev Urol. 2015;12:271–80. doi: 10.1038/nrurol.2015.57. [DOI] [PubMed] [Google Scholar]
- 12.Lutchmaya S, Baron-Cohen S, Raggatt P, Knickmeyer R, Manning JT. 2nd to 4th digit ratios, fetal testosterone and estradiol. Early Hum Dev. 2004;77:23–8. doi: 10.1016/j.earlhumdev.2003.12.002. [DOI] [PubMed] [Google Scholar]
- 13.Manning JT, Scutt D, Wilson J, Lewis-Jones DI. The ratio of 2nd to 4th digit length:a predictor of sperm numbers and concentrations of testosterone, luteinizing hormone and oestrogen. Hum Reprod. 1998;13:3000–4. doi: 10.1093/humrep/13.11.3000. [DOI] [PubMed] [Google Scholar]
- 14.Zheng Z, Cohn MJ. Developmental basis of sexually dimorphic digit ratios. Proc Natl Acad Sci U S A. 2011;108:16289–94. doi: 10.1073/pnas.1108312108. [DOI] [PMC free article] [PubMed] [Google Scholar]
- 15.Honekopp J, Bartholdt L, Beier L, Liebert A. Second to fourth digit length ratio (2D:4D) and adult sex hormone levels:new data and a meta-analytic review. Psychoneuroendocrinology. 2007;32:313–21. doi: 10.1016/j.psyneuen.2007.01.007. [DOI] [PubMed] [Google Scholar]
- 16.Richards G, Browne WV, Constantinescu M. Digit ratio (2D:4D) and amniotic testosterone and estradiol:an attempted replication of Lutchmaya et al. (2004) J Dev Orig Health Dis. 2021;12:859–64. doi: 10.1017/S2040174420001294. [DOI] [PubMed] [Google Scholar]
- 17.Mitsui T, Araki A, Imai A, Sato S, Miyashita C, et al. Effects of prenatal leydig cell function on the ratio of the second to fourth digit lengths in school-aged children. PLoS One. 2015;10:e0120636. doi: 10.1371/journal.pone.0120636. [DOI] [PMC free article] [PubMed] [Google Scholar]
- 18.Lu H, Huo ZH, Liu YJ, Shi ZY, Zhao JL. Correlations between digit ratio and infertility in Chinese men. Early Hum Dev. 2012;88:865–9. doi: 10.1016/j.earlhumdev.2012.06.007. [DOI] [PubMed] [Google Scholar]
- 19.Auger J, Le Denmat D, Berges R, Doridot L, Salmon B, et al. Environmental levels of oestrogenic and antiandrogenic compounds feminize digit ratios in male rats and their unexposed male progeny. Proc Biol Sci. 2013;280:20131532. doi: 10.1098/rspb.2013.1532. [DOI] [PMC free article] [PubMed] [Google Scholar]
- 20.Huber SE, Lenz B, Kornhuber J, Muller CP. Prenatal androgen-receptor activity has organizational morphological effects in mice. PLoS One. 2017;12:e0188752. doi: 10.1371/journal.pone.0188752. [DOI] [PMC free article] [PubMed] [Google Scholar]
- 21.Abbo O, Ferdynus C, Kalfa N, Huiart L, Sauvat F, et al. Male infants with hypospadias and/or cryptorchidism show a lower 2D/4D digit ratio than normal boys. Arch Dis Child. 2015;100:643–7. doi: 10.1136/archdischild-2014-306454. [DOI] [PubMed] [Google Scholar]
- 22.Chen Z, Lei Y, Finnell RH, Ding Y, Su Z, et al. Whole-exome sequencing study of hypospadias. IScience. 2023;26:106663. doi: 10.1016/j.isci.2023.106663. [DOI] [PMC free article] [PubMed] [Google Scholar]
- 23.Zheng Z, Armfield BA, Cohn MJ. Timing of androgen receptor disruption and estrogen exposure underlies a spectrum of congenital penile anomalies. Proc Natl Acad Sci U S A. 2015;112:E7194–203. doi: 10.1073/pnas.1515981112. [DOI] [PMC free article] [PubMed] [Google Scholar]
- 24.Orkiszewski M. A standardized classification of hypospadias. J Pediatr Urol. 2012;8:410–4. doi: 10.1016/j.jpurol.2011.08.011. [DOI] [PubMed] [Google Scholar]
- 25.Hurd PL, Bailey AA, Gongal PA, Yan RH, Greer JJ, et al. Intrauterine position effects on anogenital distance and digit ratio in male and female mice. Arch Sex Behav. 2008;37:9–18. doi: 10.1007/s10508-007-9259-z. [DOI] [PubMed] [Google Scholar]
- 26.Bailey AA, Wahlsten D, Hurd PL. Digit ratio (2D:4D) and behavioral differences between inbred mouse strains. Genes Brain Behav. 2005;4:318–23. doi: 10.1111/j.1601-183X.2004.00110.x. [DOI] [PubMed] [Google Scholar]
- 27.Xi H, Li M, Fan Y, Zhao L. A comparison of measurement methods and sexual dimorphism for digit ratio (2D:4D) in Han ethnicity. Arch Sex Behav. 2014;43:329–33. doi: 10.1007/s10508-013-0179-9. [DOI] [PMC free article] [PubMed] [Google Scholar]
- 28.Neyse L, Brañas-Garza P. Digit ratio measurement guide. Kiel Working Papers. 2014;1914:1–11. [Google Scholar]
- 29.O’Kelly F, DeCotiis K, Zu’bi F, Farhat WA, Koyle MA. Increased hand digit length ratio (2D:4D) is associated with increased severity of hypospadias in pre-pubertal boys. Pediatr Surg Int. 2019;36:247–53. doi: 10.1007/s00383-019-04600-3. [DOI] [PubMed] [Google Scholar]
- 30.Wang J, Zhao T, Chen J, Kang L, Wei Y, et al. Multiple transcriptomic profiling:p53 signaling pathway is involved in DEHP-induced prepubertal testicular injury via promoting cell apoptosis and inhibiting cell proliferation of Leydig cells. J Hazard Mater. 2021;406:124316. doi: 10.1016/j.jhazmat.2020.124316. [DOI] [PubMed] [Google Scholar]
- 31.Manning JT, Fink B. Are there any “direct” human studies of digit ratio (2D:4D) and measures of prenatal sex hormones? Early Hum Dev. 2017;113:73–4. doi: 10.1016/j.earlhumdev.2017.09.003. [DOI] [PubMed] [Google Scholar]
- 32.Manning JT. Resolving the role of prenatal sex steroids in the development of digit ratio. Proc Natl Acad Sci U S A. 2011;108:16143–4. doi: 10.1073/pnas.1113312108. [DOI] [PMC free article] [PubMed] [Google Scholar]
- 33.Swift-Gallant A, Di Rita V, Coome LA, Monks DA. Overexpression of androgen receptors masculinizes 2D:4D digit ratios in mice. Arch Sex Behav. 2021;50:3413–7. doi: 10.1007/s10508-021-02161-y. [DOI] [PubMed] [Google Scholar]
- 34.Sajjad Y, Quenby S, Nickson P, Lewis-Jones DI, Vince G. Androgen receptors are expressed in a variety of human fetal extragenital tissues:an immunohistochemical study. Asian J Androl. 2007;9:751–9. doi: 10.1111/j.1745-7262.2007.00320.x. [DOI] [PubMed] [Google Scholar]
- 35.Negro-Vilar A. Selective androgen receptor modulators (SARMs):a novel approach to androgen therapy for the new millennium. J Clin Endocrinol Metab. 1999;84:3459–62. doi: 10.1210/jcem.84.10.6122. [DOI] [PubMed] [Google Scholar]
- 36.Nordstrand A, Bovinder Ylitalo E, Thysell E, Jernberg E, Crnalic S, et al. Bone cell activity in clinical prostate cancer bone metastasis and its inverse relation to tumor cell androgen receptor activity. Int J Mol Sci. 2018;19:1223. doi: 10.3390/ijms19041223. [DOI] [PMC free article] [PubMed] [Google Scholar]
- 37.Huang CK, Luo J, Lee SO, Chang C. Concise review:androgen receptor differential roles in stem/progenitor cells including prostate, embryonic, stromal, and hematopoietic lineages. Stem Cells. 2014;32:2299–308. doi: 10.1002/stem.1722. [DOI] [PubMed] [Google Scholar]
- 38.Katayama S, Ashizawa K, Gohma H, Fukuhara T, Narumi K, et al. The expression of Hedgehog genes (Ihh, Dhh) and Hedgehog target genes (Ptc1, Gli1, Coup-TfII) is affected by estrogenic stimuli in the uterus of immature female rats. Toxicol Appl Pharmacol. 2006;217:375–83. doi: 10.1016/j.taap.2006.10.003. [DOI] [PubMed] [Google Scholar]
- 39.Ngamniyom A, Magtoon W, Nagahama Y, Sasayama Y. Expression levels of hormone receptors and bone morphogenic protein in fins of medaka. Zoolog Sci. 2009;26:74–9. doi: 10.2108/zsj.26.74. [DOI] [PubMed] [Google Scholar]
- 40.Zhou J, Meng J, Guo S, Gao B, Ma G, et al. IHH and FGF8 coregulate elongation of digit primordia. Biochem Biophys Res Commun. 2007;363:513–8. doi: 10.1016/j.bbrc.2007.08.198. [DOI] [PubMed] [Google Scholar]
- 41.Batista MR, Diniz P, Murta D, Torres A, Lopes-da-Costa L, et al. Balanced Notch-Wnt signaling interplay is required for mouse embryo and fetal development. Reproduction. 2021;161:385–98. doi: 10.1530/REP-20-0435. [DOI] [PubMed] [Google Scholar]
- 42.Steinhart Z, Angers S. Wnt signaling in development and tissue homeostasis. Development. 2018;145:dev146589. doi: 10.1242/dev.146589. [DOI] [PubMed] [Google Scholar]
- 43.Chen Y, Yu H, Pask AJ, Fujiyama A, Suzuki Y, et al. Hormone-responsive genes in the SHH and WNT/beta-catenin signaling pathways influence urethral closure and phallus growth. Biol Reprod. 2018;99:806–16. doi: 10.1093/biolre/ioy117. [DOI] [PubMed] [Google Scholar]
- 44.Alcantara MC, Suzuki K, Acebedo AR, Sakamoto Y, Nishita M, et al. Stage-dependent function of Wnt5a during male external genitalia development. Congenit Anom (Kyoto) 2021;61:212–9. doi: 10.1111/cga.12438. [DOI] [PubMed] [Google Scholar]
- 45.Oichi T, Otsuru S, Usami Y, Enomoto-Iwamoto M, Iwamoto M. Wnt signaling in chondroprogenitors during long bone development and growth. Bone. 2020;137:115368. doi: 10.1016/j.bone.2020.115368. [DOI] [PMC free article] [PubMed] [Google Scholar]
- 46.Chimal-Monroy J, Montero JA, Ganan Y, Macias D, Garcia-Porrero JA, et al. Comparative analysis of the expression and regulation of Wnt5a, Fz4, and Frzb1 during digit formation and in micromass cultures. Dev Dyn. 2002;224:314–20. doi: 10.1002/dvdy.10110. [DOI] [PubMed] [Google Scholar]
- 47.Stockdale FE, Nikovits W, Jr, Christ B. Molecular and cellular biology of avian somite development. Dev Dyn. 2000;219:304–21. doi: 10.1002/1097-0177(2000)9999:9999<::AID-DVDY1057>3.0.CO;2-5. [DOI] [PubMed] [Google Scholar]
- 48.Usami Y, Gunawardena AT, Iwamoto M, Enomoto-Iwamoto M. Wnt signaling in cartilage development and diseases:lessons from animal studies. Lab Invest. 2016;96:186–96. doi: 10.1038/labinvest.2015.142. [DOI] [PMC free article] [PubMed] [Google Scholar]
- 49.Montero JA, Lorda-Diez CI, Francisco-Morcillo J, Chimal-Monroy J, Garcia-Porrero JA, et al. Sox9 expression in amniotes:species-specific differences in the formation of digits. Front Cell Dev Biol. 2017;5:23. doi: 10.3389/fcell.2017.00023. [DOI] [PMC free article] [PubMed] [Google Scholar]
- 50.Witte F, Dokas J, Neuendorf F, Mundlos S, Stricker S. Comprehensive expression analysis of all Wnt genes and their major secreted antagonists during mouse limb development and cartilage differentiation. Gene Expr Patterns. 2009;9:215–23. doi: 10.1016/j.gep.2008.12.009. [DOI] [PubMed] [Google Scholar]
- 51.Yang T, Bassuk AG, Fritzsch B. Prickle1 stunts limb growth through alteration of cell polarity and gene expression. Dev Dyn. 2013;242:1293–306. doi: 10.1002/dvdy.24025. [DOI] [PMC free article] [PubMed] [Google Scholar]
- 52.Farrera-Hernandez A, Marin-Llera JC, Chimal-Monroy J. WNT5A-Ca2+-CaN-NFAT signalling plays a permissive role during cartilage differentiation in embryonic chick digit development. Dev Biol. 2021;469:86–95. doi: 10.1016/j.ydbio.2020.10.003. [DOI] [PubMed] [Google Scholar]
- 53.H’Ng CH, Khaladkar A, Rosello-Diez A. Look who's TORking:mTOR-mediated integration of cell status and external signals during limb development and endochondral bone growth. Front Cell Dev Biol. 2023;11:1153473. doi: 10.3389/fcell.2023.1153473. [DOI] [PMC free article] [PubMed] [Google Scholar]
- 54.Stricker S, Mundlos S. Mechanisms of digit formation:human malformation syndromes tell the story. Dev Dyn. 2011;240:990–1004. doi: 10.1002/dvdy.22565. [DOI] [PubMed] [Google Scholar]
- 55.Witte F, Chan D, Economides AN, Mundlos S, Stricker S. Receptor tyrosine kinase-like orphan receptor 2 (ROR2) and Indian hedgehog regulate digit outgrowth mediated by the phalanx-forming region. Proc Natl Acad Sci U S A. 2010;107:14211–6. doi: 10.1073/pnas.1009314107. [DOI] [PMC free article] [PubMed] [Google Scholar]
- 56.Parada C, Banavar SP, Khalilian P, Rigaud S, Michaut A, et al. Mechanical feedback defines organizing centers to drive digit emergence. Dev Cell. 2022;57:854–66.e56. doi: 10.1016/j.devcel.2022.03.004. [DOI] [PubMed] [Google Scholar]
- 57.Yang Y, Topol L, Lee H, Wu J. Wnt5a and Wnt5b exhibit distinct activities in coordinating chondrocyte proliferation and differentiation. Development. 2003;130:1003–15. doi: 10.1242/dev.00324. [DOI] [PubMed] [Google Scholar]
- 58.Recinella L, Orlando G, Ferrante C, Chiavaroli A, Brunetti L, et al. Adipokines:new potential therapeutic target for obesity and metabolic, rheumatic, and cardiovascular diseases. Front Physiol. 2020;11:578966. doi: 10.3389/fphys.2020.578966. [DOI] [PMC free article] [PubMed] [Google Scholar]
- 59.Hang K, Ye C, Xu J, Chen E, Wang C, et al. Apelin enhances the osteogenic differentiation of human bone marrow mesenchymal stem cells partly through Wnt/beta-catenin signaling pathway. Stem Cell Res Ther. 2019;10:189. doi: 10.1186/s13287-019-1286-x. [DOI] [PMC free article] [PubMed] [Google Scholar]
- 60.Wang Y, Zhao X, Lotz M, Terkeltaub R, Liu-Bryan R. Mitochondrial biogenesis is impaired in osteoarthritis chondrocytes but reversible via peroxisome proliferator-activated receptor gamma coactivator 1alpha. Arthritis Rheumatol. 2015;67:2141–53. doi: 10.1002/art.39182. [DOI] [PMC free article] [PubMed] [Google Scholar]
- 61.Ruvkun G, Lehrbach N. Regulation and functions of the ER-associated Nrf1 transcription factor. Cold Spring Harb Perspect Biol. 2023;15:a041266. doi: 10.1101/cshperspect.a041266. [DOI] [PMC free article] [PubMed] [Google Scholar]
- 62.Wang W, Song B, Anbarchian T, Shirazyan A, Sadik JE, et al. Smad2 and Smad3 regulate chondrocyte proliferation and differentiation in the growth plate. PLoS Genet. 2016;12:e1006352. doi: 10.1371/journal.pgen.1006352. [DOI] [PMC free article] [PubMed] [Google Scholar]
- 63.Lorda-Diez CI, Duarte-Olivenza C, Hurle JM, Montero JA. Transforming growth factor beta signaling:the master sculptor of fingers. Dev Dyn. 2022;251:125–36. doi: 10.1002/dvdy.349. [DOI] [PubMed] [Google Scholar]
- 64.Sakou T, Onishi T, Yamamoto T, Nagamine T, Sampath T, et al. Localization of Smads, the TGF-beta family intracellular signaling components during endochondral ossification. J Bone Miner Res. 1999;14:1145–52. doi: 10.1359/jbmr.1999.14.7.1145. [DOI] [PubMed] [Google Scholar]
- 65.Yang YQ, Tan YY, Wong R, Wenden A, Zhang LK, et al. The role of vascular endothelial growth factor in ossification. Int J Oral Sci. 2012;4:64–8. doi: 10.1038/ijos.2012.33. [DOI] [PMC free article] [PubMed] [Google Scholar]
- 66.Kanczler JM, Oreffo RO. Osteogenesis and angiogenesis:the potential for engineering bone. Eur Cell Mater. 2008;15:100–14. doi: 10.22203/ecm.v015a08. [DOI] [PubMed] [Google Scholar]
- 67.Wang Y, Pan L, Moens CB, Appel B. Notch3 establishes brain vascular integrity by regulating pericyte number. Development. 2014;141:307–17. doi: 10.1242/dev.096107. [DOI] [PMC free article] [PubMed] [Google Scholar]
Associated Data
This section collects any data citations, data availability statements, or supplementary materials included in this article.
Supplementary Materials
Three subgroups according to the position of the urethral orifice after full mobilization of the skin flaps during the operation.
The topGO directed acyclic graph (DAG) shows the hierarchical relationship of enriched GO entries of differential proteins between the WT and HO groups. Changes in limb and appendage morphogenesis or development biosynthesis are included in the developmental process. WT: wild-type mice; HO: homozygous mice; GO: gene ontology.
Apelin signaling pathway maps between the WT and HO groups. WT: wild-type mice; HO: homozygous mice.