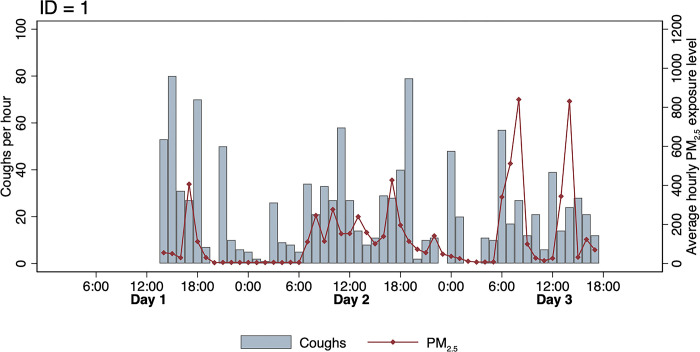
Fig 1. Time series for participant ID = 1 showing the trends in number of coughs per hour and average hourly PM2.5 exposure level.
Hourly PM2.5 concentrations and hourly cough counts appear to fluctuate throughout the day. Both measures tend to be highest during the daytime hours that coincide with cooking and mealtimes.

