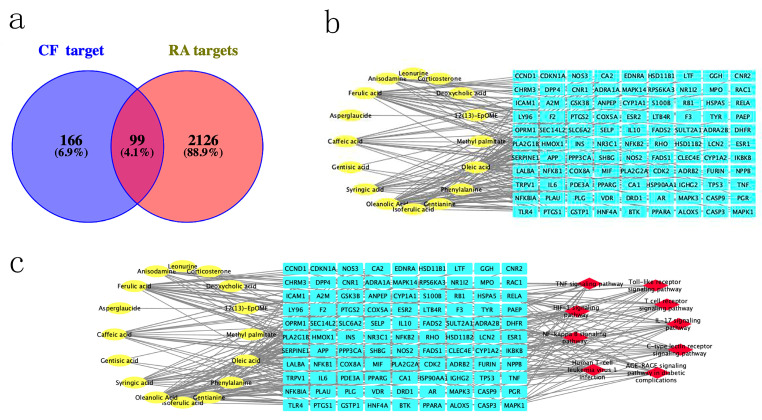
Figure 3.
Network pharmacological analysis of CF for treating RAL: (a) Venn diagram showing intersection of CF-related targets and RA-related predicted targets; (b) plot of association between CF compounds and RA. The 16 yellow nodes on the left represent the main compounds of CF, and the 99 CF targets for the treatment of RA are labeled in blue on the right-hand side; (c) CTS network of CF in treatment of RA. Yellow nodes indicate the main compounds of CF, red nodes denote the 9 signaling pathways screened from the KEGG analysis of the PPI network, and blue nodes symbolize the overlapped target genes linked to both CF and RA.

