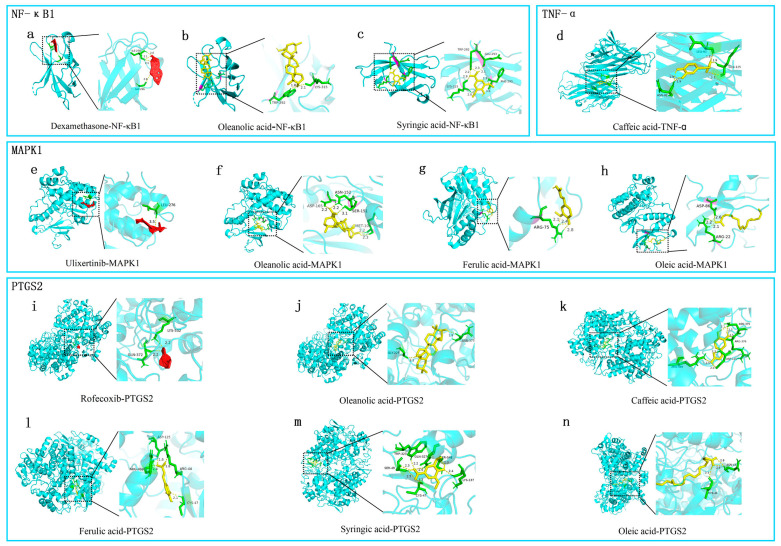
Figure 5.
Pattern diagram of molecular docking: (a–c) molecular docking of dexamethasone, oleanolic acid, and syringic acid to NFκB1; (d) molecular docking of caffeic acid to TNF-α; (e–h) molecular docking of ulixertinib, oleanolic acid, ferulic acid and oleic acid to MAPK1; (i–n) molecular docking of rofecoxib, oleanolic acid, caffeic acid, ferulic acid, syringic acid, and oleic acid to PTGTS2. The yellow dashed line represents hydrogen bonds and the number next to the yellow dashed line represents the length of the hydrogen bond. The green part represents the amino acid residue. The yellow compounds were the core compounds screened from network pharmacology analysis. The red compound was inhibitor.

