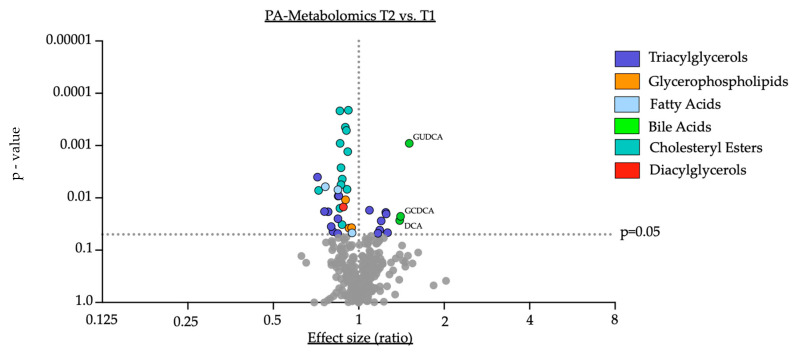
Figure 2.
PA-Metabolomics T2 vs. T1. Data are presented in the x-axis as fold change, calculated as the ratio between serum concentration (µmol/L) at T2 divided by serum concentration at T1. Individual p-values are provided on the y-axis, determined by a comparison of means of serum concentration between the two timepoints using paired Student’s t-test or Wilcoxon test where eligible. Grey dots indicate not significantly altered metabolites. Key: GUDCA—Glycoursodeoxycholic acid; DCA—deoxycholic acid; GCDCA—Glycochenodeoxycholic acid.

