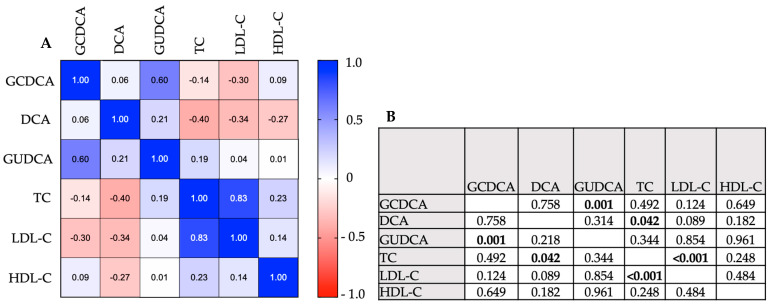
Figure 3.
Correlation analysis between bile acids and cholesterol levels upon PA treatment. (A) Data are presented as Pearson/Spearman’s r in the correlation coefficient matrix. +1.0 indicates a positive correlation, −1.0 indicates a negative correlation. (B) Pearson/Spearman’s correlation—p-values. Bold values display significant p-values. Key: GUDCA—Glycoursodeoxycholic acid; DCA—deoxycholic acid; GCDCA—Glycochenodeoxycholic acid; TC—total cholesterol; LDL-C—low-density lipoprotein-cholesterol; HDL-C—high-density lipoprotein-cholesterol.

