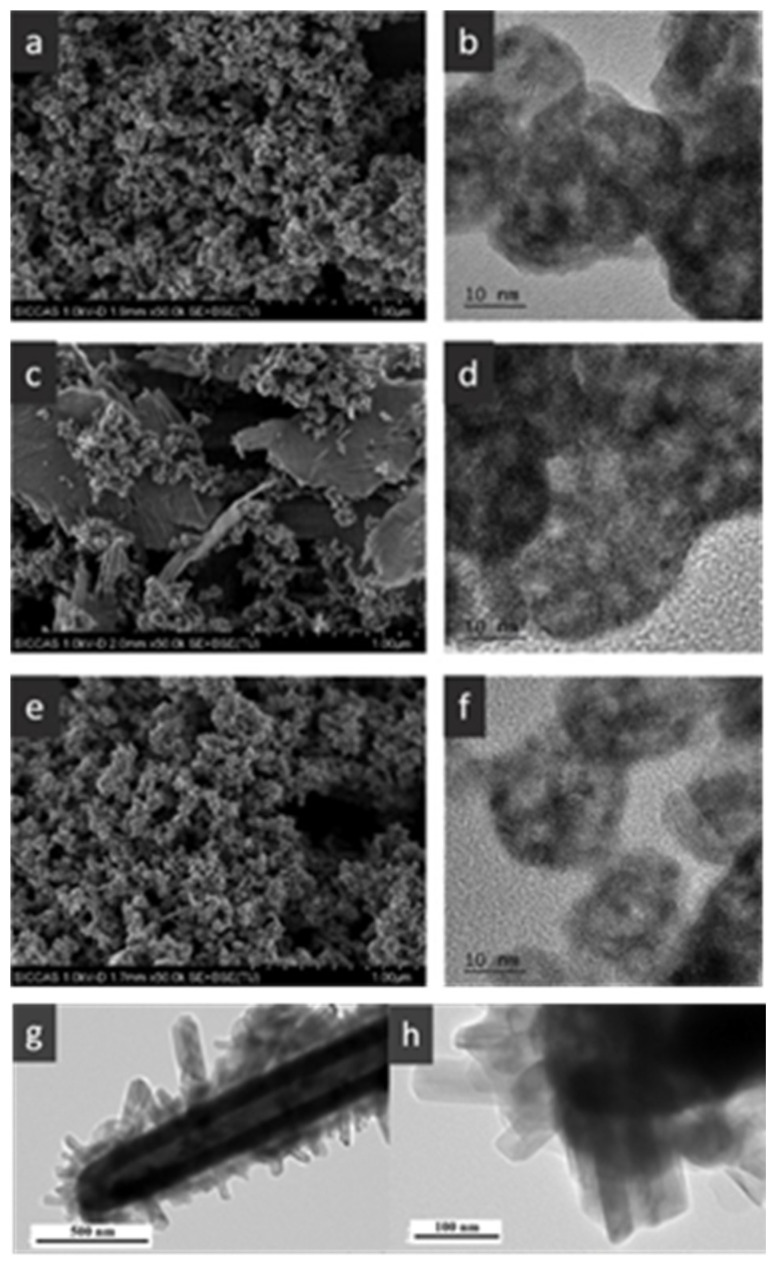
Figure 7.
(a,c,e) SEM images of the CMC-Cp-a, -b , and -c, respectively; (b,d,f) TEM images of the CMC-Cp-a, -b, and -c, respectively (Ce/Mn/Cu molar ratio of 84/16/16 (CMC-Cp-a), 84/8/8 (CMC-Cp-b) or 84/32/16 (CMC-Cp-c)) reproduced from ref. [136]; (g,h) TEM images of the CeO2@MnO2 reproduced from ref. [139].

