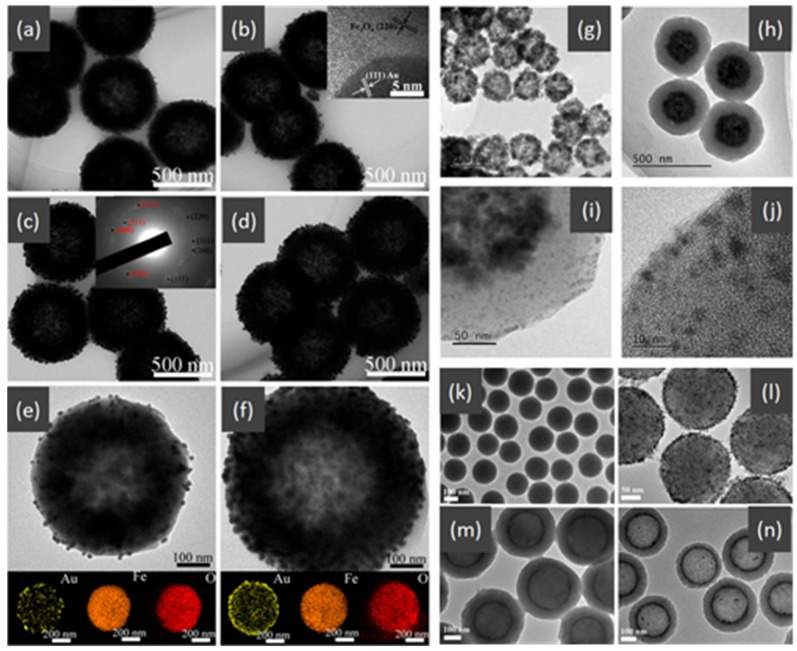
Figure 16.
TEM images of the Fe3O4–Au 5 mL (a) and Fe3O4–Au 20 mL with the HRTEM image (inset) (b); Fe3O4–Au 40 mL with the SAED pattern (inset) (c) and Fe3O4–Au 60 mL (d); TEM images of single Fe3O4–Au 5 mL (e) and Fe3O4–Au 60 mL (f) microspheres and corresponding EDS elemental mapping images (Au, Fe, and O). Figure reproduced from ref. [201] TEM images of (g) hollow Fe3O4 microspheres, (h) Fe3O4/P(GMA-EGDMA) microspheres, and (i,j) Fe3O4/P (GMA-EGDMA)SO3H/Au-PPy microspheres. Figure reproduced from ref. [202]. TEM images of (k) SiO2 nanospheres, (l) Au/Fe3O4/SiO2, (m) Au/Fe3O4/SiO2@TiO2, (n) Au/Fe3O4@hTiO2. Figure reproduced from ref. [203].

