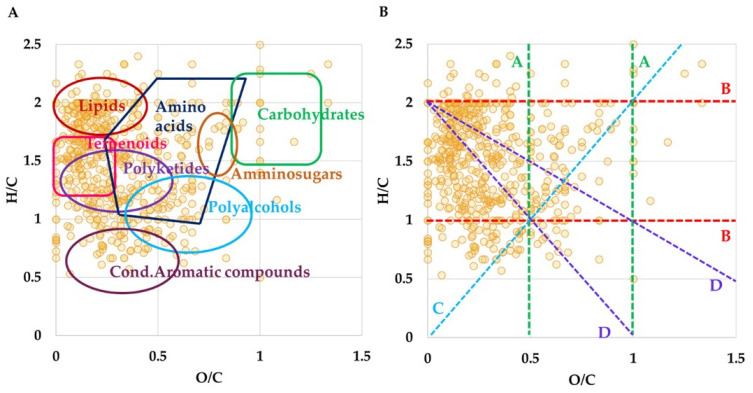
Figure 1.
(A) Van Krevelen plot gained from the molecular formulas obtained by ESI FT-ICR MS analysis of LO. (B) Van Krevelen diagram displays homology series (dashed lines) related to the following chemical reactions: A lines (green) stand for (de)hydrogenation; B lines (red) stand for oxidation or reduction; C lines (light blue) stands for (de)hydration and condensation processes; D lines (purple) stand for (de)methylation.

