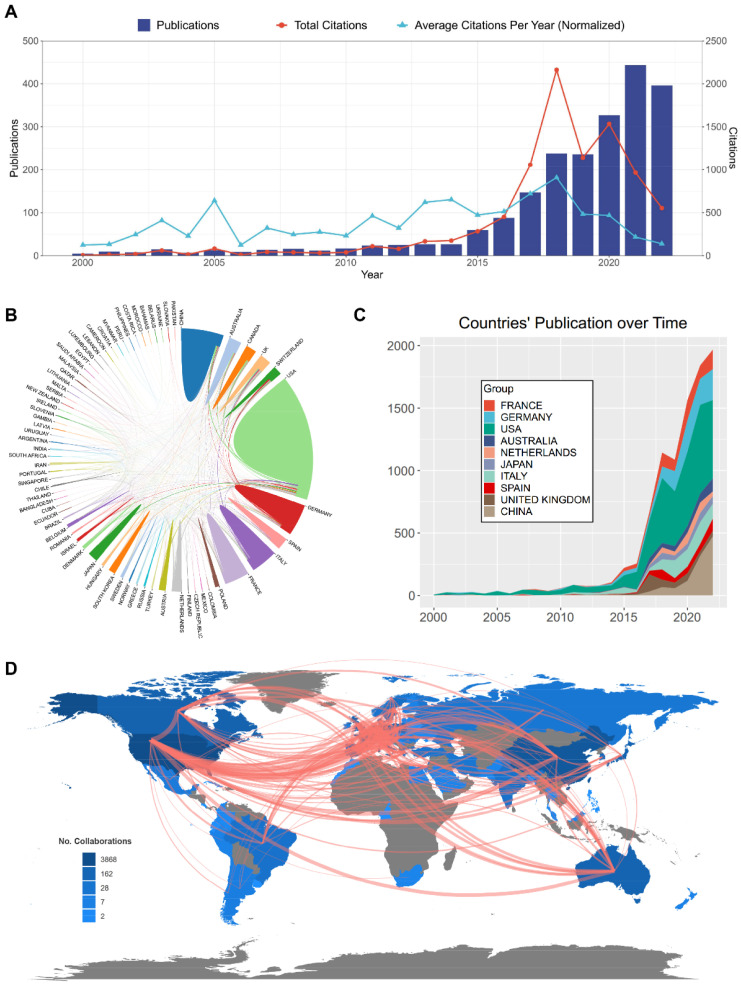
Figure 2.
Distribution of countries/regions and the co-operation relations. (A) Analysis of annual publications and citation trends from 2000 to 2022. (B) The network map visualizing international collaborations across countries. (C) The changing trend of the annual publication number in the top 10 countries from 2000 to 2022. (D) The world map that visualizing the distribution of countries/regions worldwide and their collaborations, presented in a network format. Red lines indicate the strength of collaboration. This map was downloaded from “Bibliometrix” public online website.

