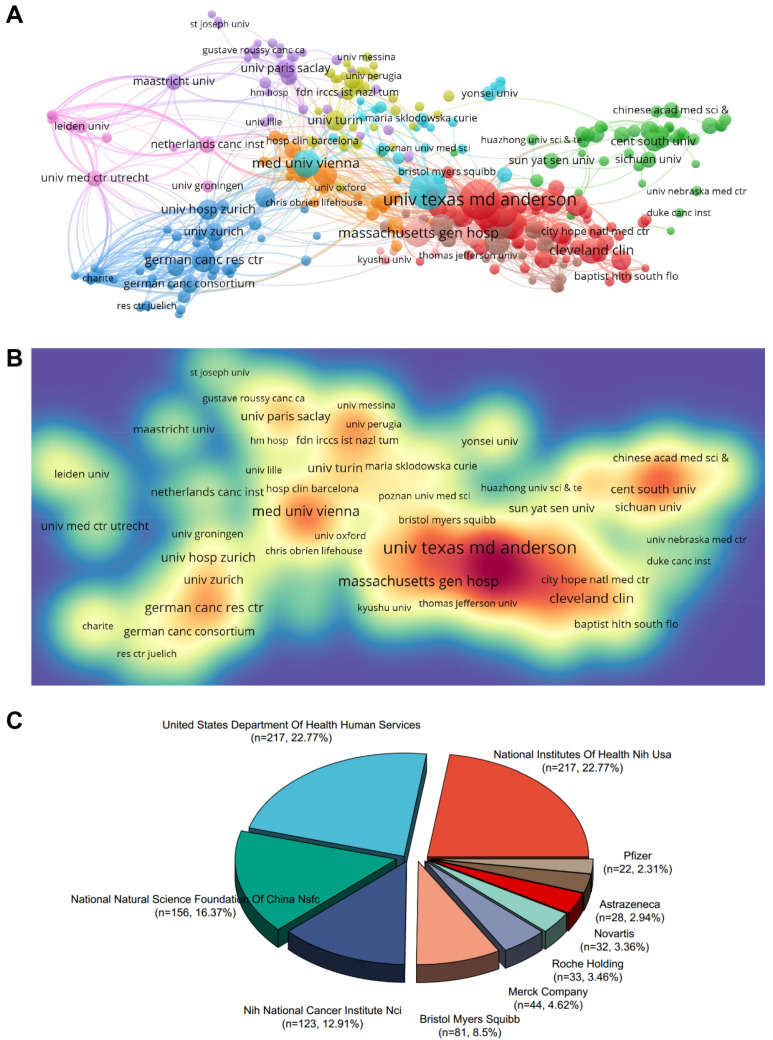
Figure 3.
Contribution of productive institutions and funding agencies. (A) The VOSviewer visualization map shows institution co-authorship analyses overlaid. The nodes of different colors represent the institutions with different clusters, and the size of the nodes indicates their node sizes. (B) Institutions were mapped according to their spectral density. The deeper colors of the nodes represent the higher the number of documents published by the institution. (C) The top 10 funding agencies sponsored the highest number of studies in the field of immunotherapy for brain metastases.

