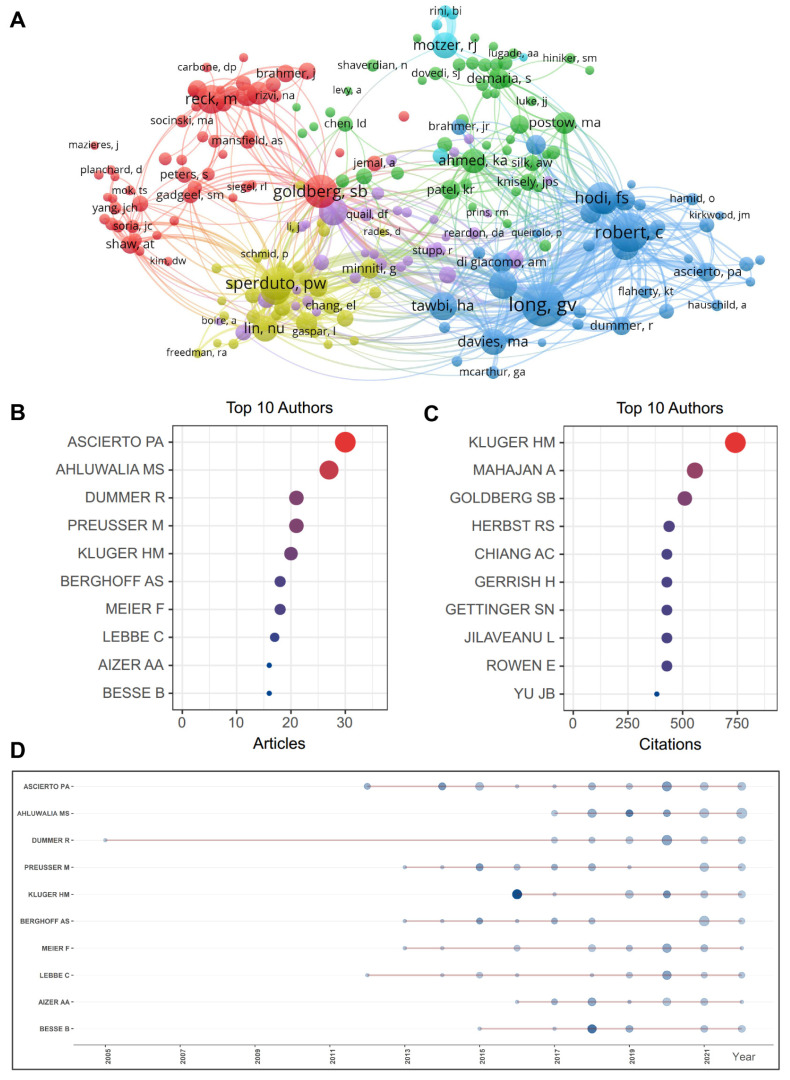
Figure 4.
Contribution of active authors. (A) Visualization map of authors investigating immunotherapies for brain metastases. The nodes denote authors, with bigger circles representing more publications. Lines between the nodes denote the relationship between authors on the same article, with wider lines representing more frequent collaborations. (B) Bubble diagram displaying the most published authors in the field of immunotherapy for brain metastases (related to Table 3 summarizing total citations and h-index of these authors). (C) Bubble diagram displaying the most cited authors in the field of immunotherapy for brain metastases. (D) Top 5 authors’ production over time is displayed.

