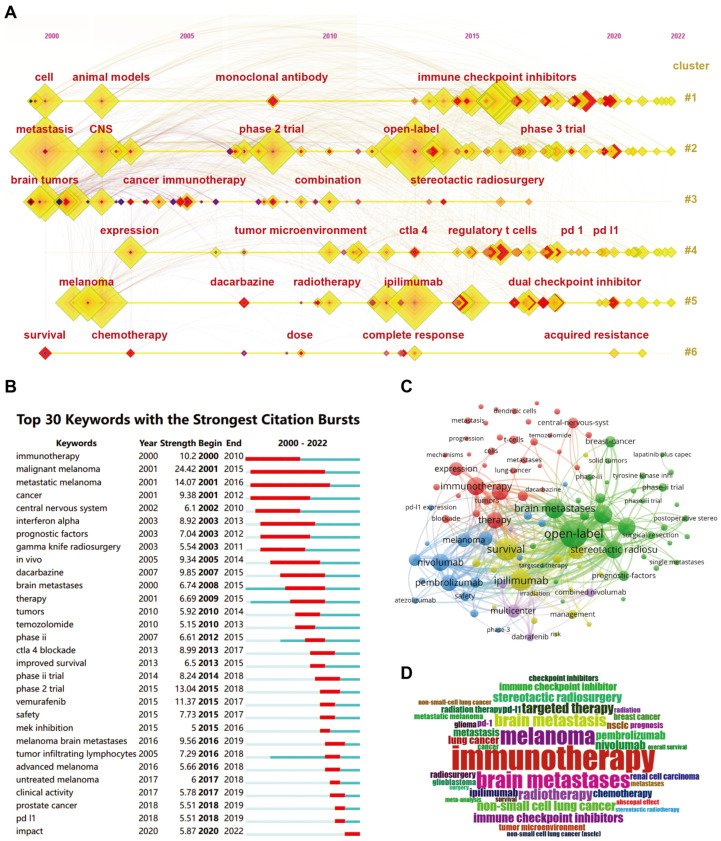
Figure 5.
Analysis of keywords co-occurrence and burstiness. (A) Visualization map of timeline view of keywords analysis by CiteSpace. (B) Timeline distribution of cluster analysis of the top 30 keywords. (C) Keywords PLUS analysis with network visualization map of via VOSviewer. (D) Keywords representation with word cloud.

