Figure 6.
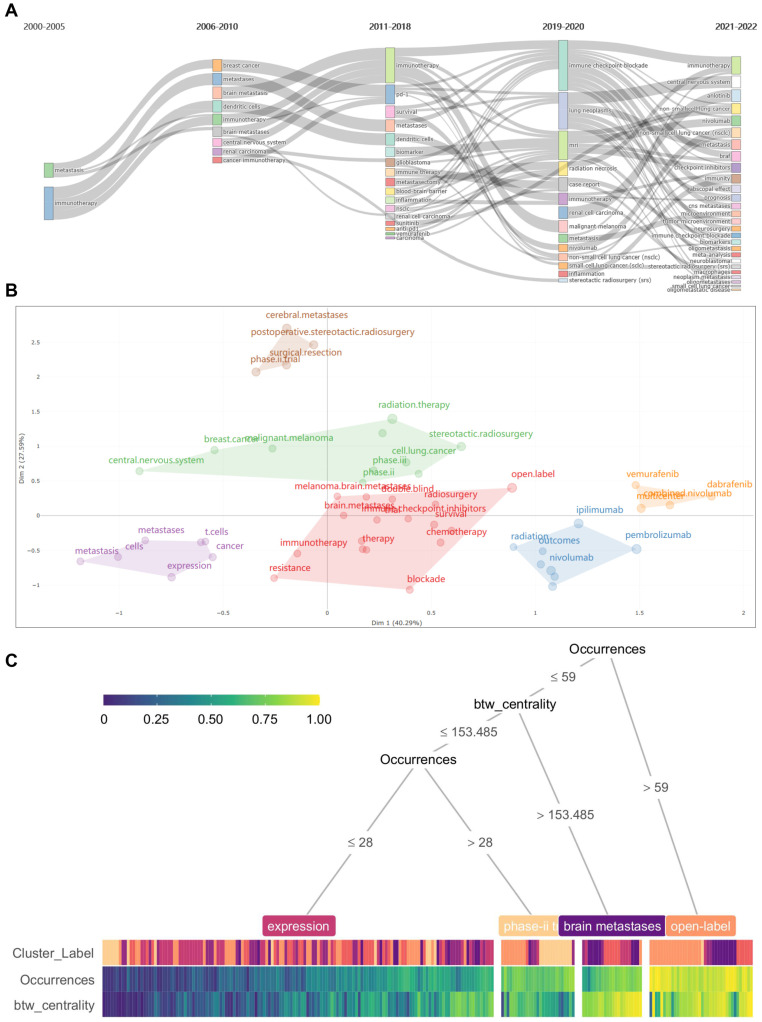
Analysis of keywords vicissitude and clustering. (A) The Sankey diagram illustrated the occurrence frequency of keywords over time. (B) The keywords in each time period can be divided into six categories. (C) Decision tree algorithm revealed that the keywords could be distinguished according to the occurrences and centrality.

