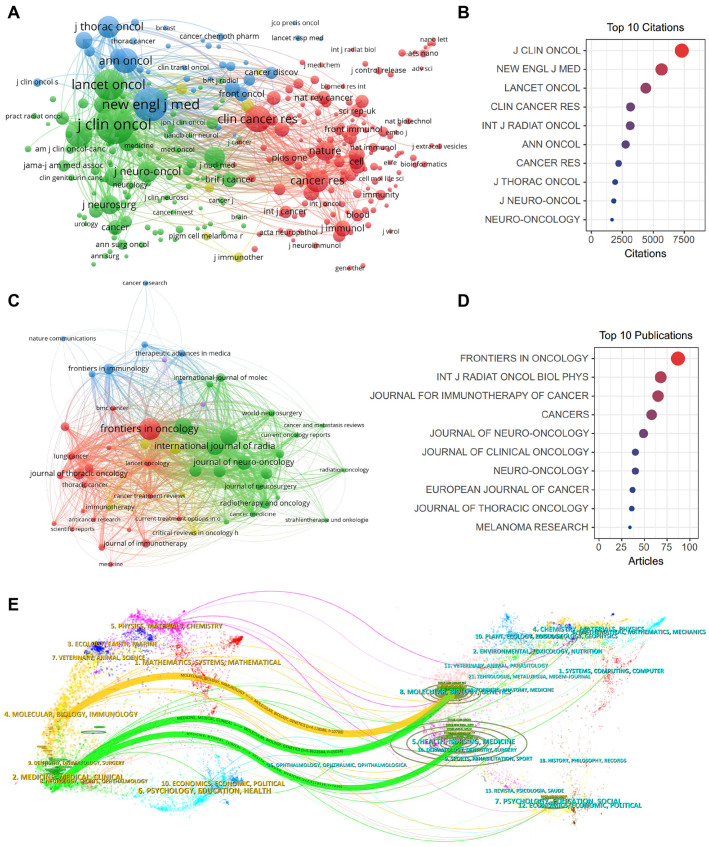
Figure 7.
Analysis of influential journals and co-cited journals. (A) The network visualization maps of the most influential journals produced with VOSviewer. (B) Bubble diagram displaying the most influential journals in the field of immunotherapy for brain metastases. (C) The network visualization maps of the most co-cited journals produced with VOSviewer. (D) Bubble diagram displaying the most co-cited journals in the field of immunotherapy for brain metastases. (E) A biplot overlay of journals with research on immunotherapy for brain metastases. (Left side depicts research fields covered by citing journals, right side shows research fields covered by cited journals).

