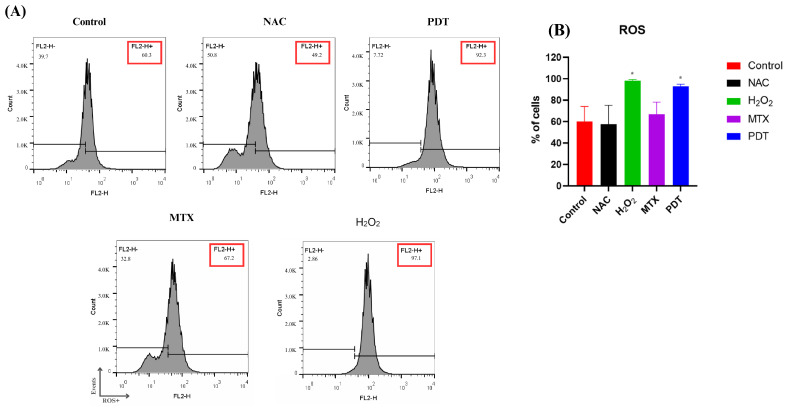
Figure 3.
Analysis of ROS production in B16-F10 cells after treatments. (A) Representative histogram of reactive oxygen species production by B16-F10 cells pre- and post-treatments. (B) Quantification of the percentage of cells in each treatment group after 2 h. Cells were treated with NAC (negative control), H2O2 (positive control), photodynamic therapy (PDT), and mitoxantrone (MTX). The results presented are from three independent experiments, with the average percentage of cells in each treatment group ± SEM. * p < 0.05 compared with control.

