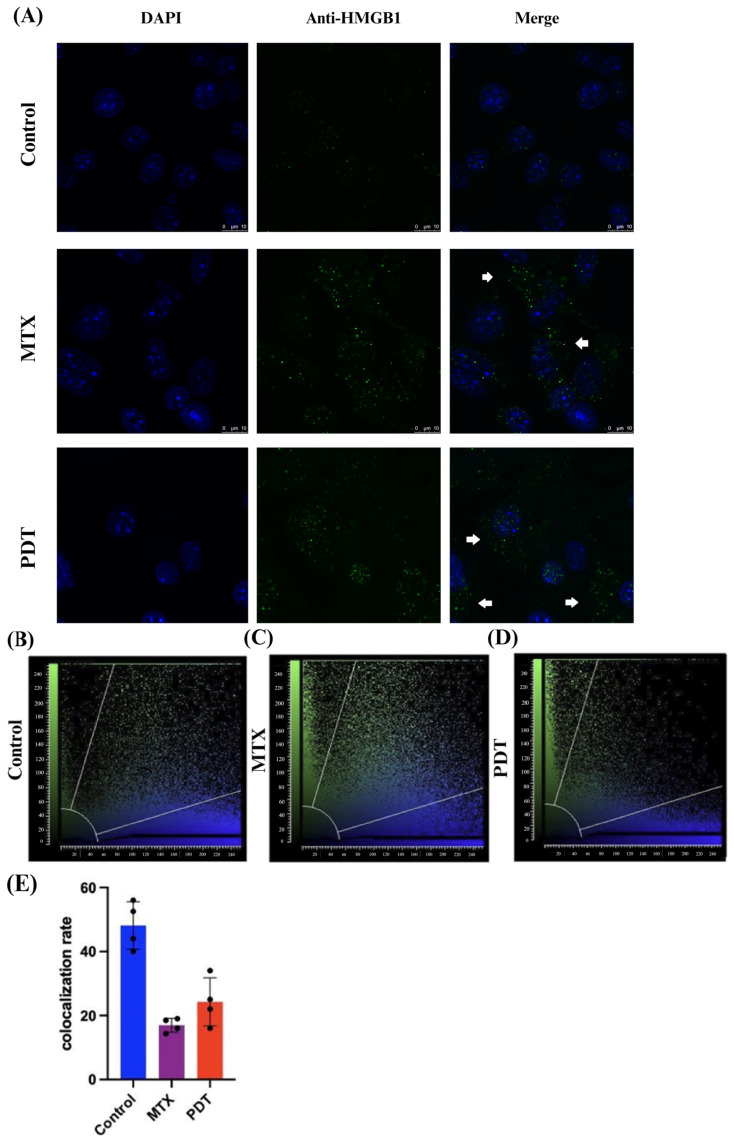
Figure 4.
Immunostaining of HMGB1 and quantitative fluorescence analysis in B16-F10 cells after 24 h of treatment. (A) DAPI staining the nucleus in blue, green marking the HMGB1 protein, and the overlay of both labels. Arrows indicate the extravasation of HMGB1 from the nucleus and its presence in the cellular cytoplasm. The 3D reconstruction videos can be found in the Supplementary Material (Video S1, Video S2, and Video S3). (B–D) Co-localization plots of the 3D reconstructions, where the blue color represents voxels positive for the nucleus (DAPI), and the green color represents voxels positive for HMGB1. Points present in the intermediate region of the plot represent co-localized voxels. The quantification of co-localization is depicted in (E).

