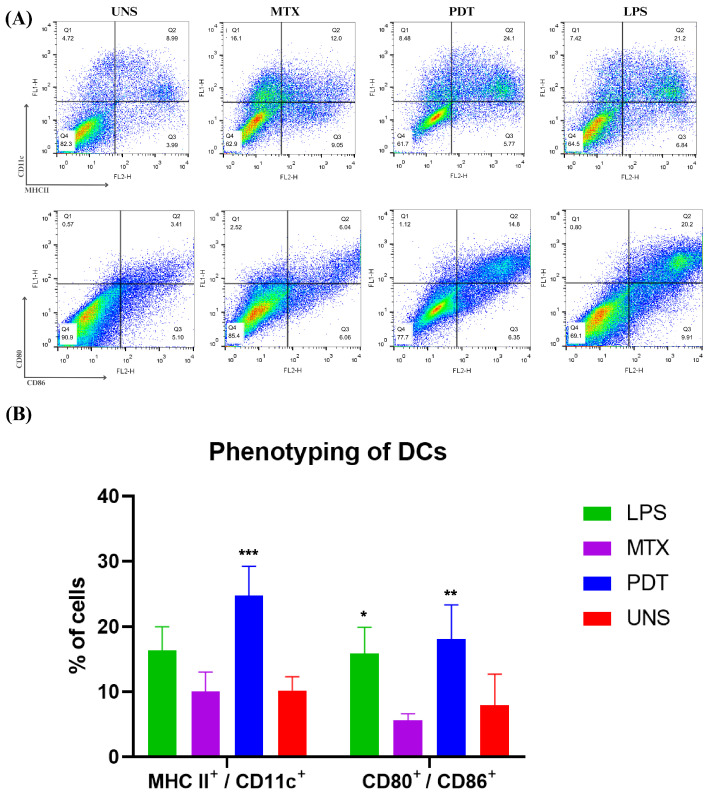
Figure 10.
Dendritic cell phenotyping analysis after 24 h of cell co-culture. (A) Dot plot of dendritic cells co-cultured with B16-F10 cells in each treatment group after 24 h. The groups included cells treated with lipopolysaccharide (LPS), mitoxantrone (MTX), photodynamic therapy (PDT), and unstimulated cells (UNS). The markers used were CD11c, MHCII, CD80, and CD86. (B) Quantification and graphical representation of the percentage of dendritic cells co-cultured with B16-F10 cells in each treatment group after 24 h. The presented results are from three independent experiments, with the average percentage of cells in each treatment ± SEM. * p < 0.05, ** p < 0.01, and *** p < 0.001 compared with the control.

