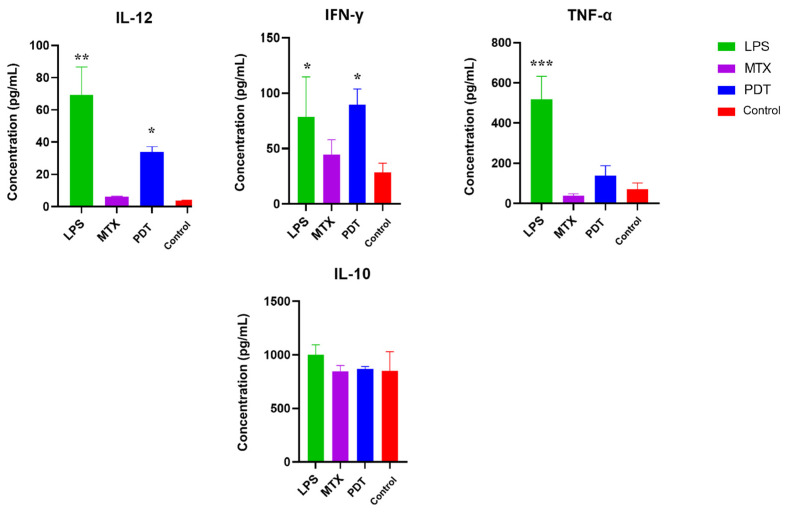
Figure 11.
Analysis of cytokine production by dendritic cells and B16-F10 cells after 24 h of treatment. Quantification of cytokines after 24 h of treatment with photodynamic therapy (PDT), mitoxantrone (MTX), and lipopolysaccharide (LPS). The cytokines analyzed were IL-12, TNF-α, IL-10, and IFN-γ. Data represent the mean ± SEM of three independent experiments performed in triplicate. * p < 0.05, ** p < 0.01, and *** p < 0.001 compared with untreated control.

