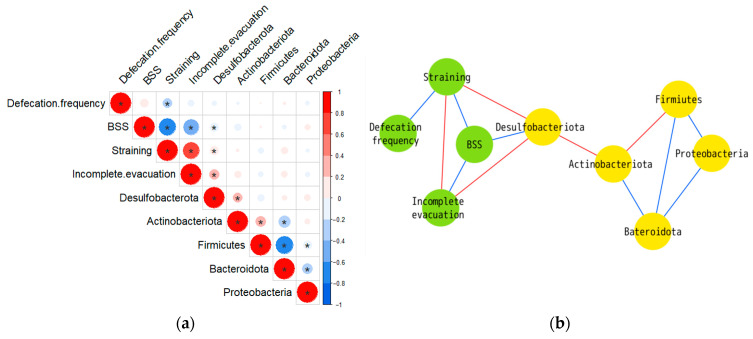
Figure 4.
(a) Matrix of Spearman’s correlation coefficients. Color intensity indicates magnitude of correlation (* p < 0.05). Blue denotes a negative correlation and red denotes a positive correlation. The correlation coefficient values are presented in Table S3. (b) Correlation network. The network was visualized in Cytoscape. The nodes are microbiota (yellow) and bowel habits (green). Blue edges denote a significant negative and red edges denote a significant positive correlation.

