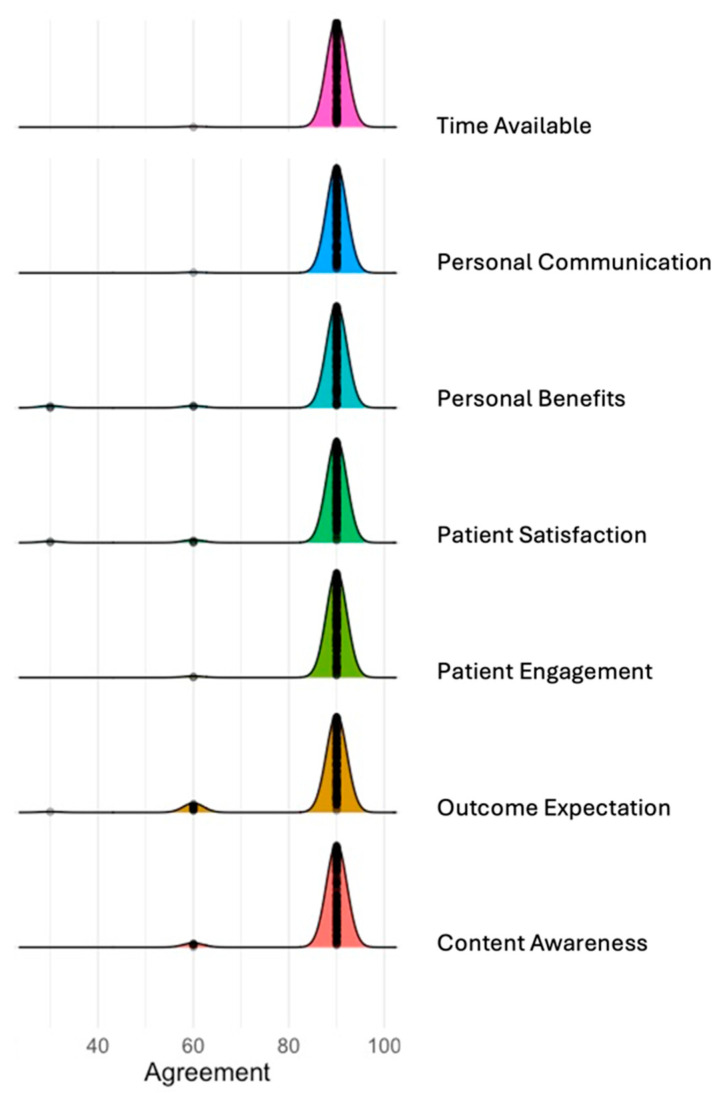
Figure 3.
Patients reported determinants of implementation using MIDI determinants. The ridgeline plot displays the distribution of agreement levels for the MIDI determinants. Each coloured ridge represents the distribution of responses for a determinant, with the width of each curve indicating the spread of agreement levels, and the peak represents the most frequent level of agreement among respondents.

