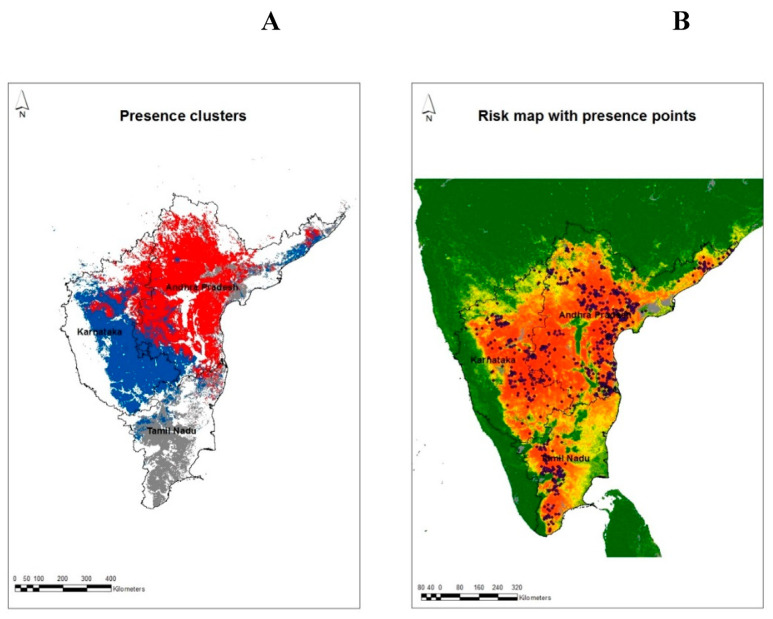
Figure 4.
(A) Distribution of clusters in Model 3, with 3 presence and 3 absence clusters. The absence clusters are shown in white. Presence clusters are shown in red, blue and grey color. Notice that each cluster is relatively restricted geographically, one to each state. (B) Risk map developed with Model 3 with bluetongue presence points (blue dots).

