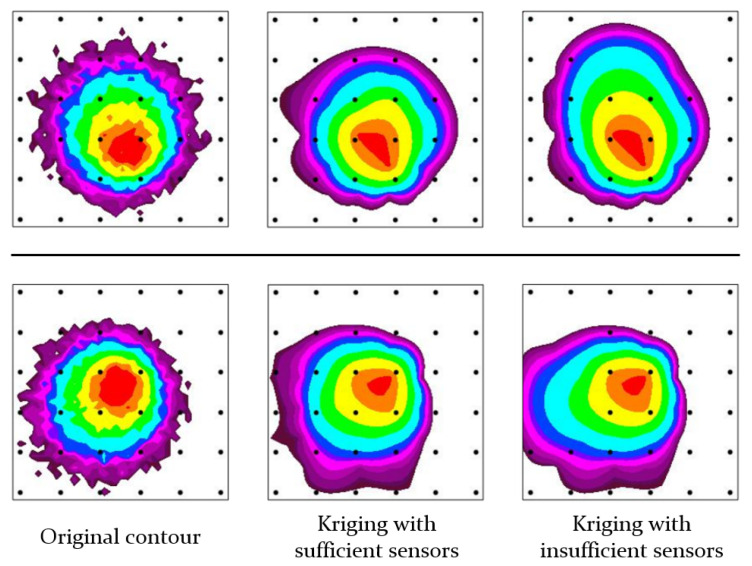
Figure 1.
Difference in the reliability of contours according to the number of sensors. The pictures on the left are the original contours obtained using the gas diffusion simulator we developed. The middles are the contours created using Kriging interpolation based on a sufficient number of values sampled from the original contours. The pictures on the right are the contours generated based on an insufficient number of values. The black dots represent the positions of chemical sensors. The concentration data on those points are used for Kriging interpolation.

