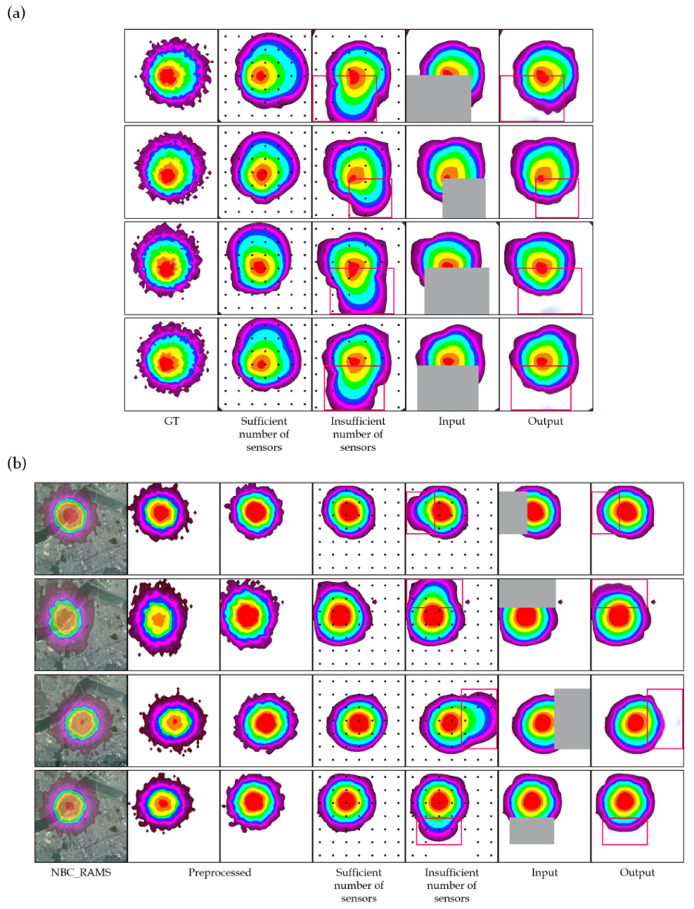
Figure 6.
(a) The results of validation using the developed diffusion simulation model. From the left, the simulation result; the spatial interpolation results using only the concentration of a sufficient or insufficient number of black dots; contours with the low-reliability parts erased; and the result filled by the model. (b) The results of validation using the NBC_RAMS. The image and contour representing the results of NBC_RAMS were added on the left, and an image preprocessed to be suitable for the model is shown in the third column from the left. The remaining images represent the same as in (a). The red boxes indicate the regions that were erased and reconstructed.

