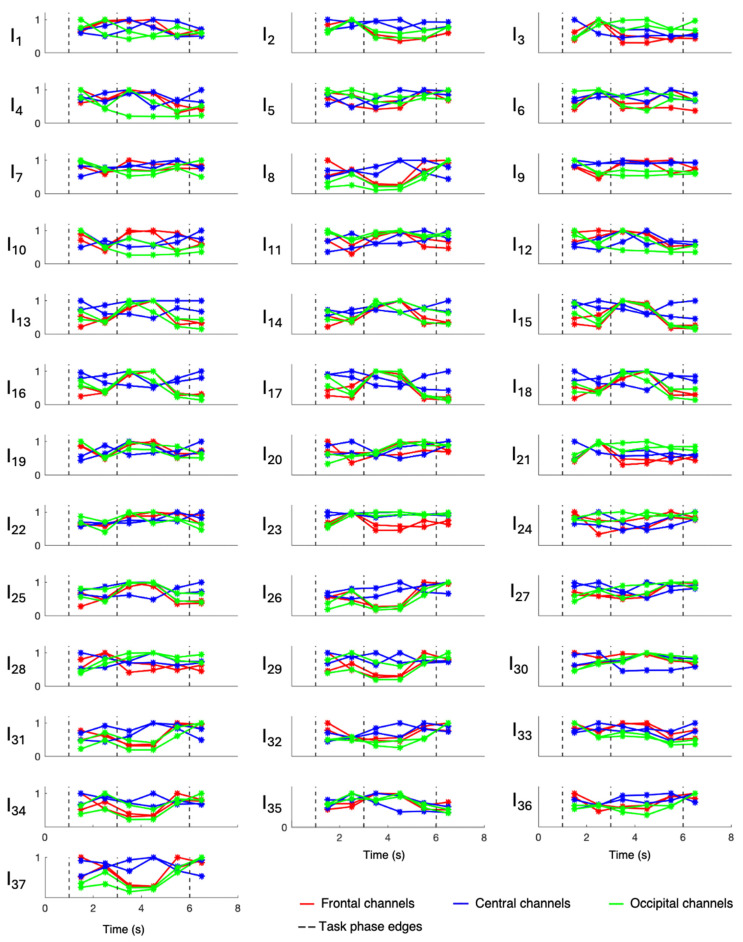
Figure 7.
Involvement indexes over time related to the overall evaluation of patients 3, 6, 7, 8, and 9 (axes limits were reported only on the first panel of each row/last panel of each column, referring to the entire row/column). The figure is divided into 37 panels, one per involvement index. Each panel contains six colored lines, one per EEG channel. Red lines refer to frontal channels (F3 and F4), blue lines refer to central channels (C3 and C4), and green lines refer to occipital channels (O1 and O2). Each line represents the trend of the involvement index over the time instants considered, since it connects the values (star markers) assumed by the index in the recursively extracted EEG windows. Dotted lines delineate the different phases of the WM task.

