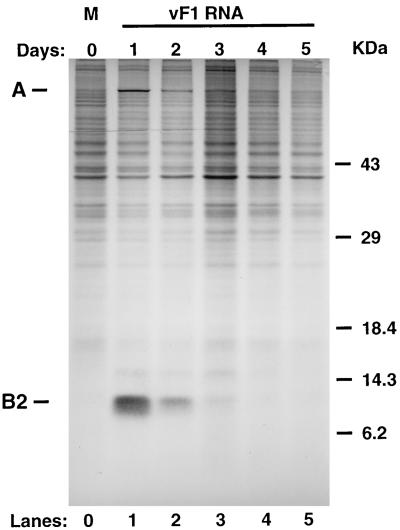
FIG. 3.
Analysis of FHV protein synthesis. Cells were transfected with authentic FHV RNA1 as indicated in the legend to Fig. 1. At 24-h intervals, the cells were labeled for 3 h by metabolic incorporation with [35S]Met-[35S]Cys. Labeled proteins were separated on an SDS–12.5% polyacrylamide gel and visualized by autoradiography. Lanes: 0, mock transfected; 1 to 5, transfected with FHV RNA1. The migration pattern of molecular mass standards is indicated at right in kilodaltons.

