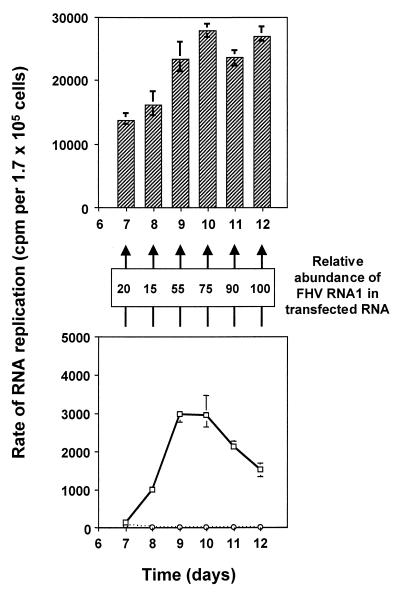
FIG. 8.
Replication in naive cells of RNAs isolated from pIND-FHV1 transfected cells after shutoff. (Lower panel) Reproduction of Fig. 6A (right panel): solid line, cells transfected with pIND-FHV1[0,0]; dotted line, mock transfected cells. (Middle panel) The relative abundance of FHV RNA1 in the total RNA pool isolated at each time point was determined by primer extension with an RNA1-specific primer, followed by densitometric analysis, as described in Materials and Methods. The amounts are expressed as percentages of the maximum (day 12) value. (Upper panel) Portions (4%) of the total RNAs isolated at each time point in Fig. 6A (right panel) were transfected into fresh monolayers of EcR-CHO cells. After 24 h, the products of RNA replication were labeled, analyzed, and normalized as described in Fig. 1.

