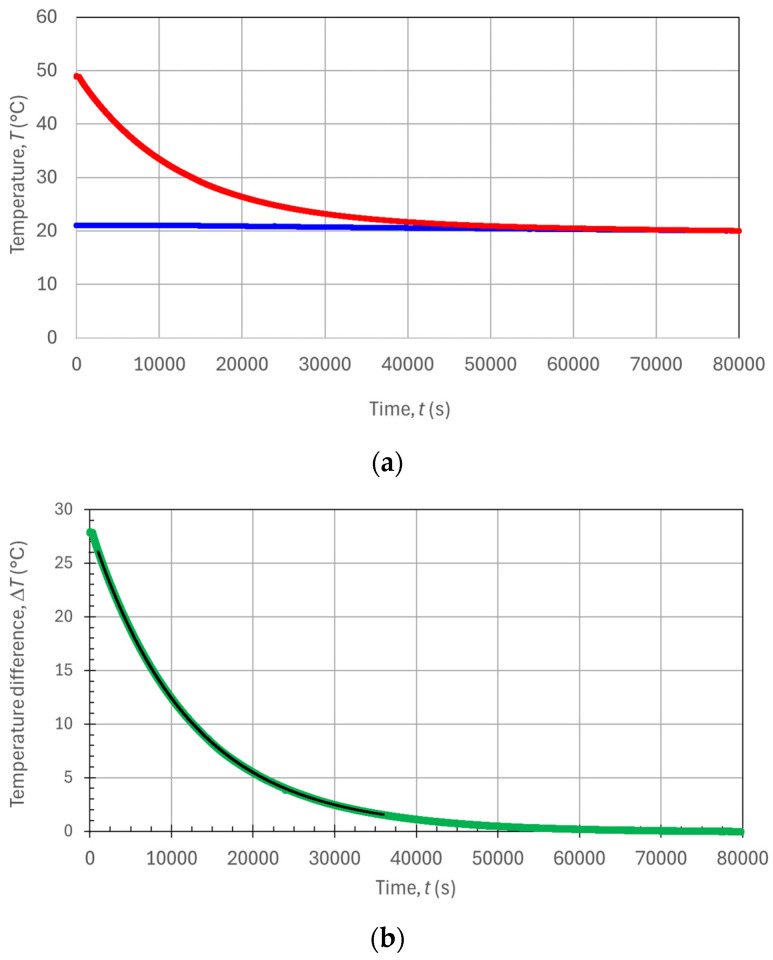
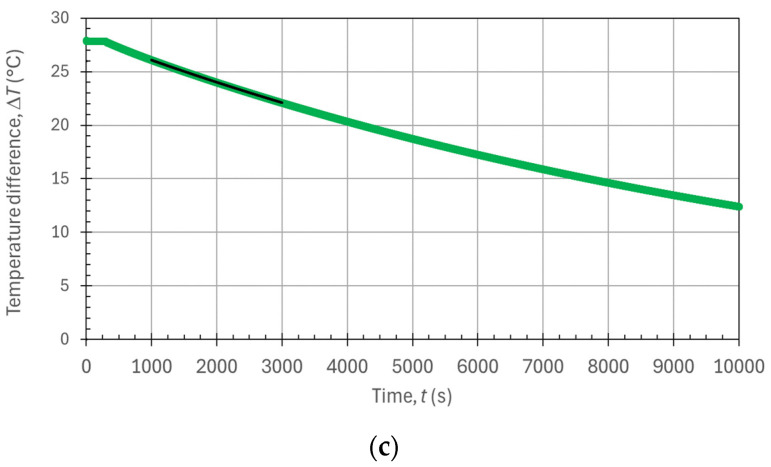
Figure 6.
Plots of the measured temperatures as a function of time during the transient condition: (a) temperatures T2 (red trace) and T1 (blue trace); (b) temperature transient ΔT(t) (green trace) and its fit (black trace) over a 36,000 s time interval; and (c) temperature transient ΔT(t) (green trace) and its fit (black trace) over a 2000 s time interval.


