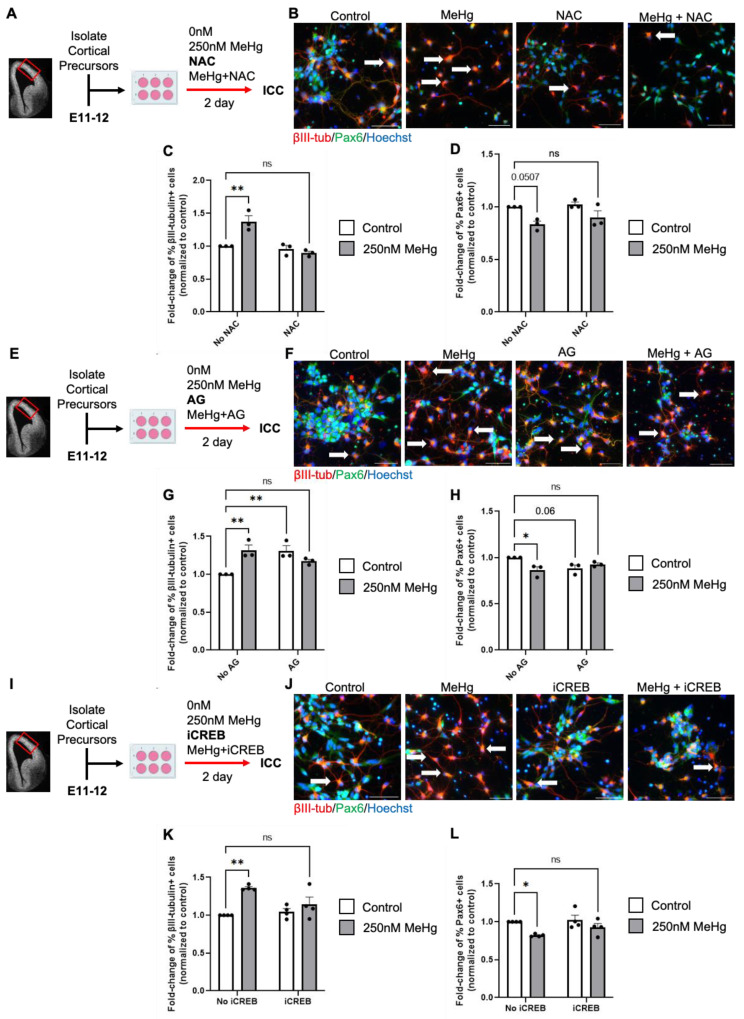
Figure 4.
Methylglyoxal (MGO) and the Akt-ERK-CREB pathway mediates MeHg-induced neuronal differentiation. (A) Workflow of E11–12 RGPs exposed to four conditions: (i) control (0 ppm MeHg + 0 μM NAC), (ii) 250 nM MeHg + 0 μM NAC, (iii) 0 nM MeHg + 600 μM NAC, (iv) co-treatment of 250 nM MeHg + 600 μM NAC for 2 days, followed by immunocytochemical analysis. The red box indicates the region dissected to obtain RGPs. (B) Images of RGPs immunostained for Pax6 (green), βIII-tubulin (red), and counterstained for Hoechst (blue). White arrows indicated βIII-tubulin+ cells. Scale bar: 50 μm. (C) Quantitative analysis of βIII-tubulin+ cells, normalized to a control group, n = 3 independent experiments, Two-way ANOVA (NAC × MeHg interaction F(1, 8) = 17.25, P = 0.0032, NAC F(1, 8) = 24.11, P = 0.0012, MeHg F(1, 8) = 8.542, P = 0.0192). (D) Quantitative analysis of Pax6+ cells, normalized to a control group, n = 3 independent experiments, Two-way ANOVA (NAC × MeHg interaction F(1, 8) = 0.3460, P = 0.5726, NAC F(1, 8) = 1.473, P = 0.2596, MeHg F(1, 8) = 15.41, P = 0.0044). (E) Workflow of RGPs exposed to four conditions: (i) control (0 nM MeHg + 0 μM AG), (ii) 250 nM MeHg + 0 μM AG, (iii) 0 nM MeHg + 100 μM AG, (iv) co-treatment of 250 nM MeHg + 100 μM AG for 2 days, followed by immunocytochemical analysis. The red box indicates the region dissected to obtain RGPs. (F) Images of RGPs immunostained for Pax6 (green), βIII-tubulin (red), and counterstained for Hoechst (blue). White arrows indicated βIII-tubulin+ cells. Scale bar: 50 μm. (G) Quantitative analysis of βIII-tubulin+ cells, normalized to a control group, n = 3 independent experiments, Two-way ANOVA (AG × MeHg interaction F(1, 8) = 21.54, P = 0.0017, AG F(1, 8) = 2.756, P = 0.1355, MeHg F(1, 8) = 3.258, P = 0.1087. (H) Quantitative analysis of Pax6+ cells, normalized to control, n = 3 independent experiments, Two-way ANOVA (AG × MeHg interaction F(1, 8) = 11.05, P = 0.0105 AG F(1, 8) = 0.8509, P = 0.3833, MeHg F(1, 8) = 3.127, P = 0.1150). (I) Workflow of RGPs exposed to four conditions: (i) control (0 nM MeHg + 0 nM iCREB, (ii) 250 nM MeHg + 0 nM iCREB, (iii) 80 nM iCREB + 0 nM MeHg, (iv) co-treatment 250 nM MeHg + 80 nM iCREB for 2 days, followed by immunocytochemical analysis. The red box indicates the region dissected to obtain RGPs. (J) Images of RGPs immunostained for Pax6 (green), βIII-tubulin (red), and counterstained for Hoechst (blue). White arrows indicated βIII-tubulin+ cells. Scale bar: 50 μm. (K) Quantitative analysis of βIII-tubulin+ cells, normalized to control, n = 4 independent experiments, Two-way ANOVA (iCREB × MeHg interaction F(1, 12) = 6.012 P = 0.0305, iCREB F(1, 12) = 2.554, P = 0.1360, MeHg F(1, 12) = 18.17, P = 0.0011. (L) Quantitative analysis of Pax6+ cells, normalized to control, n = 4 independent experiments, Two-way ANOVA (iCREB × MeHg interaction F (1, 12) = 1.057, P = 0.3242, iCREB F(1, 12) = 2.633, P = 0.1306, MeHg F(1, 12) = 11.73, P = 0.005. post hoc, * p < 0.05; ** p < 0.01. Error bars indicate the SEM.

