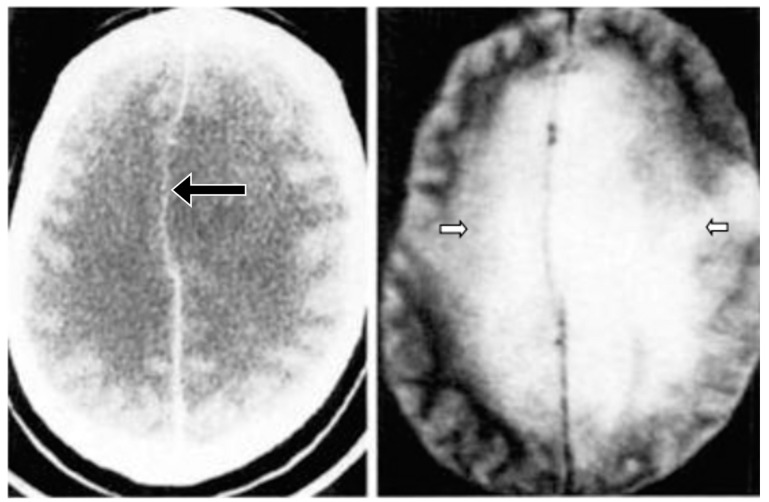
Figure 9.
CT (left) and STIR (right) images of a glioma (August 1985) [10]. Displacement of the falx is seen on the CT scan (left, black arrow) but there are no other abnormal features. The STIR image (right) shows very extensive high signal abnormalities in both cerebral hemispheres (open arrows). The high signal abnormalities on the STIR image are in normal appearing white matter on the CT image.

